Author: Michael Thomas (Ketchbrook Analytics) - Website - LinkedIn - GitHub - Twitter
View the Table - Repo
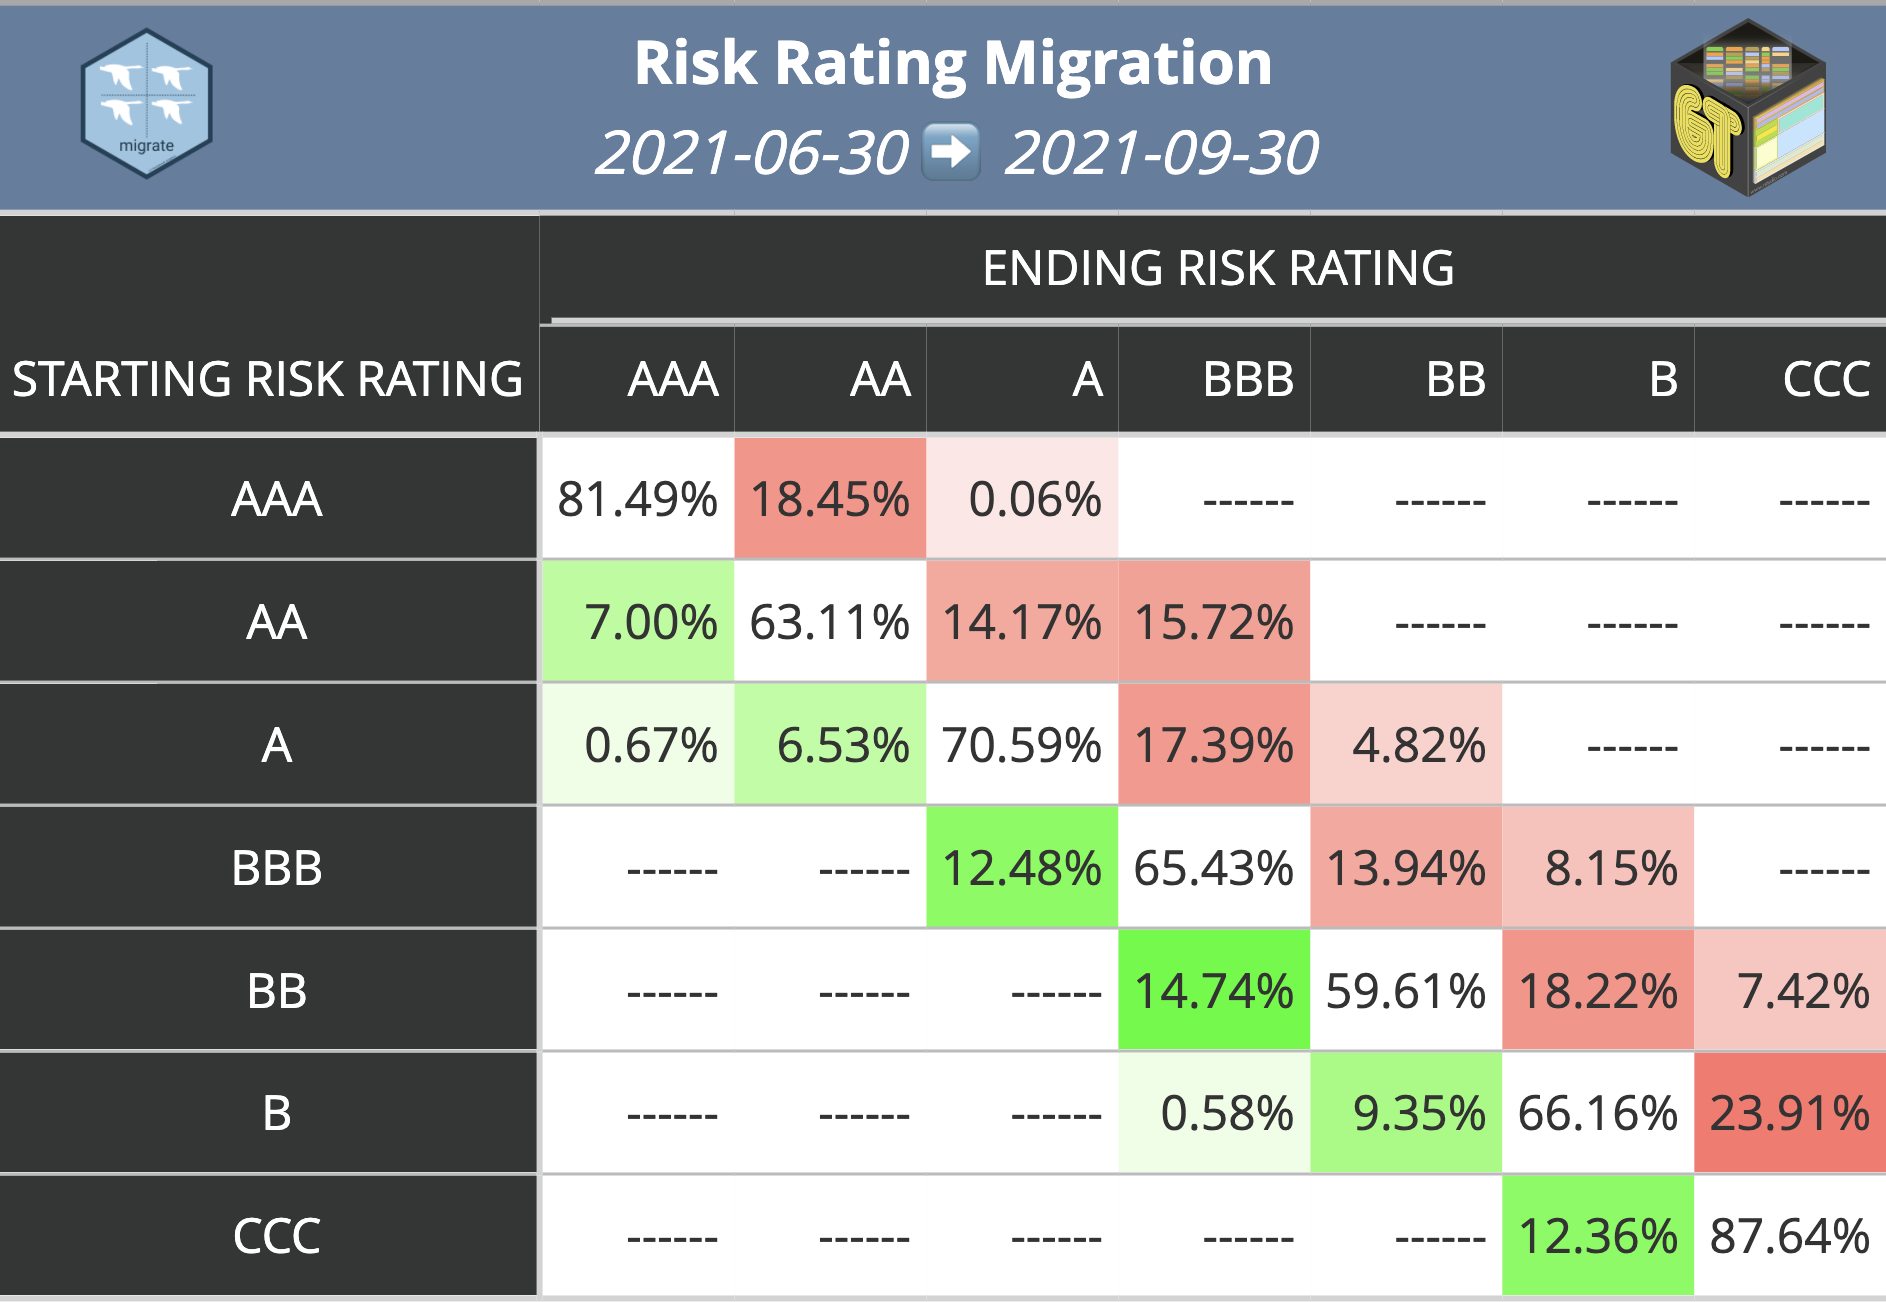
Motivated by the 2021 Table Contest, we decided to make a table submission that aligned with the recent v0.4.0 release of the migrate R package for building state transition matrices. If you are not familiar with state transition matrices, they are a common type of data visualization used in risk management (we recommend checking out migrate's GitHub repository to learn more).
You can view our blog post about how we built beautiful state transition matrices (and applied some tricky conditional formatting) using migrate + gt: Managing Credit Risk with {migrate} + {gt} - An Introduction to Building Beautiful State Transition Matrices
Unique Aspects of this Project
There are a few unique aspects of this project that may be of interest to those working with the {gt} package:
- Custom Conditional Formatting
- Embedding Images in Table Header
- Accessing the Socrata API via
RSocrata
Custom Conditional Formatting
A somewhat complicated aspect to conditionally formatting these transition matrices is that the formatting needs to be applied to a varying number of cells across all columns. We developed a custom function fmt_migrate() to make the formatting logic agnostic and flexible.
Embedding Images in Table Header
To spruce up our gt tables, we decorated the table headers with images embedded with clickable hyperlinks. You can see how we went about doing that in our blog post.
Accessing the Socrata API via {RSocrata}
Lastly, we concluded our analysis by analyzing Moody's bond rating data for each town in the State of Connecticut. This open dataset served as a great use case for applying the power of migrate + gt together.
The {RSocrata} package provides an easy way to query data from the Socrata API, which backs many government open data repositories (including Connecticut's).