Author: Abdoul ISSA BIDA - AbdoulMa on GitHub - Twitter - Personal website
View the Table - Repo
Data Scraping
RStudio is tending to become a single home for Python and R. So I decided to take advantage of both languages for the scraping phase. Everything could have been done with a single language but this phase was also for me the opportunity to combine the best of both languages.
The power of the reticulate package to use R and Python together in an R Markdown document has made this task much easier.
Python
The complete information of each wine is contained on its dedicated page. The first step was therefore to retrieve the page links of the wines that interest me according to the criteria that I will have previously defined for a search.
As part of my scraping, I will define several searches (the most prestigious wines on the platform, the best American wines, the best Burgundy wines for less than 35 euros ... etc)
This first phase of scraping was therefore carried out using Python and the various popular scraping packages it offers, namely: selenium , seleniumwire and bs4 . I mainly used the webdridriver function from seleniumwire for browsing and automation of actions on the pages and the BeautifulSoup function from bs4 for the retrieval of information inside the tags.
The complete scraping script is located here.
Please feel free to contact me if you have any difficulty launching the Python chunks.
R
Once the page links have been retrieved, the second phase consists of browsing each page and retrieving the various information concerning the wine.
As explained above, I could have done this second part with Python as well, but for more ease, I preferred to do it with R and all the ecosystem of packages it offers for scraping:
{rvest}to harvest data from web pages{RSelenium}because I have to wait for the page to load completely before scraping the data and more important, to automate some remote browser tasks.
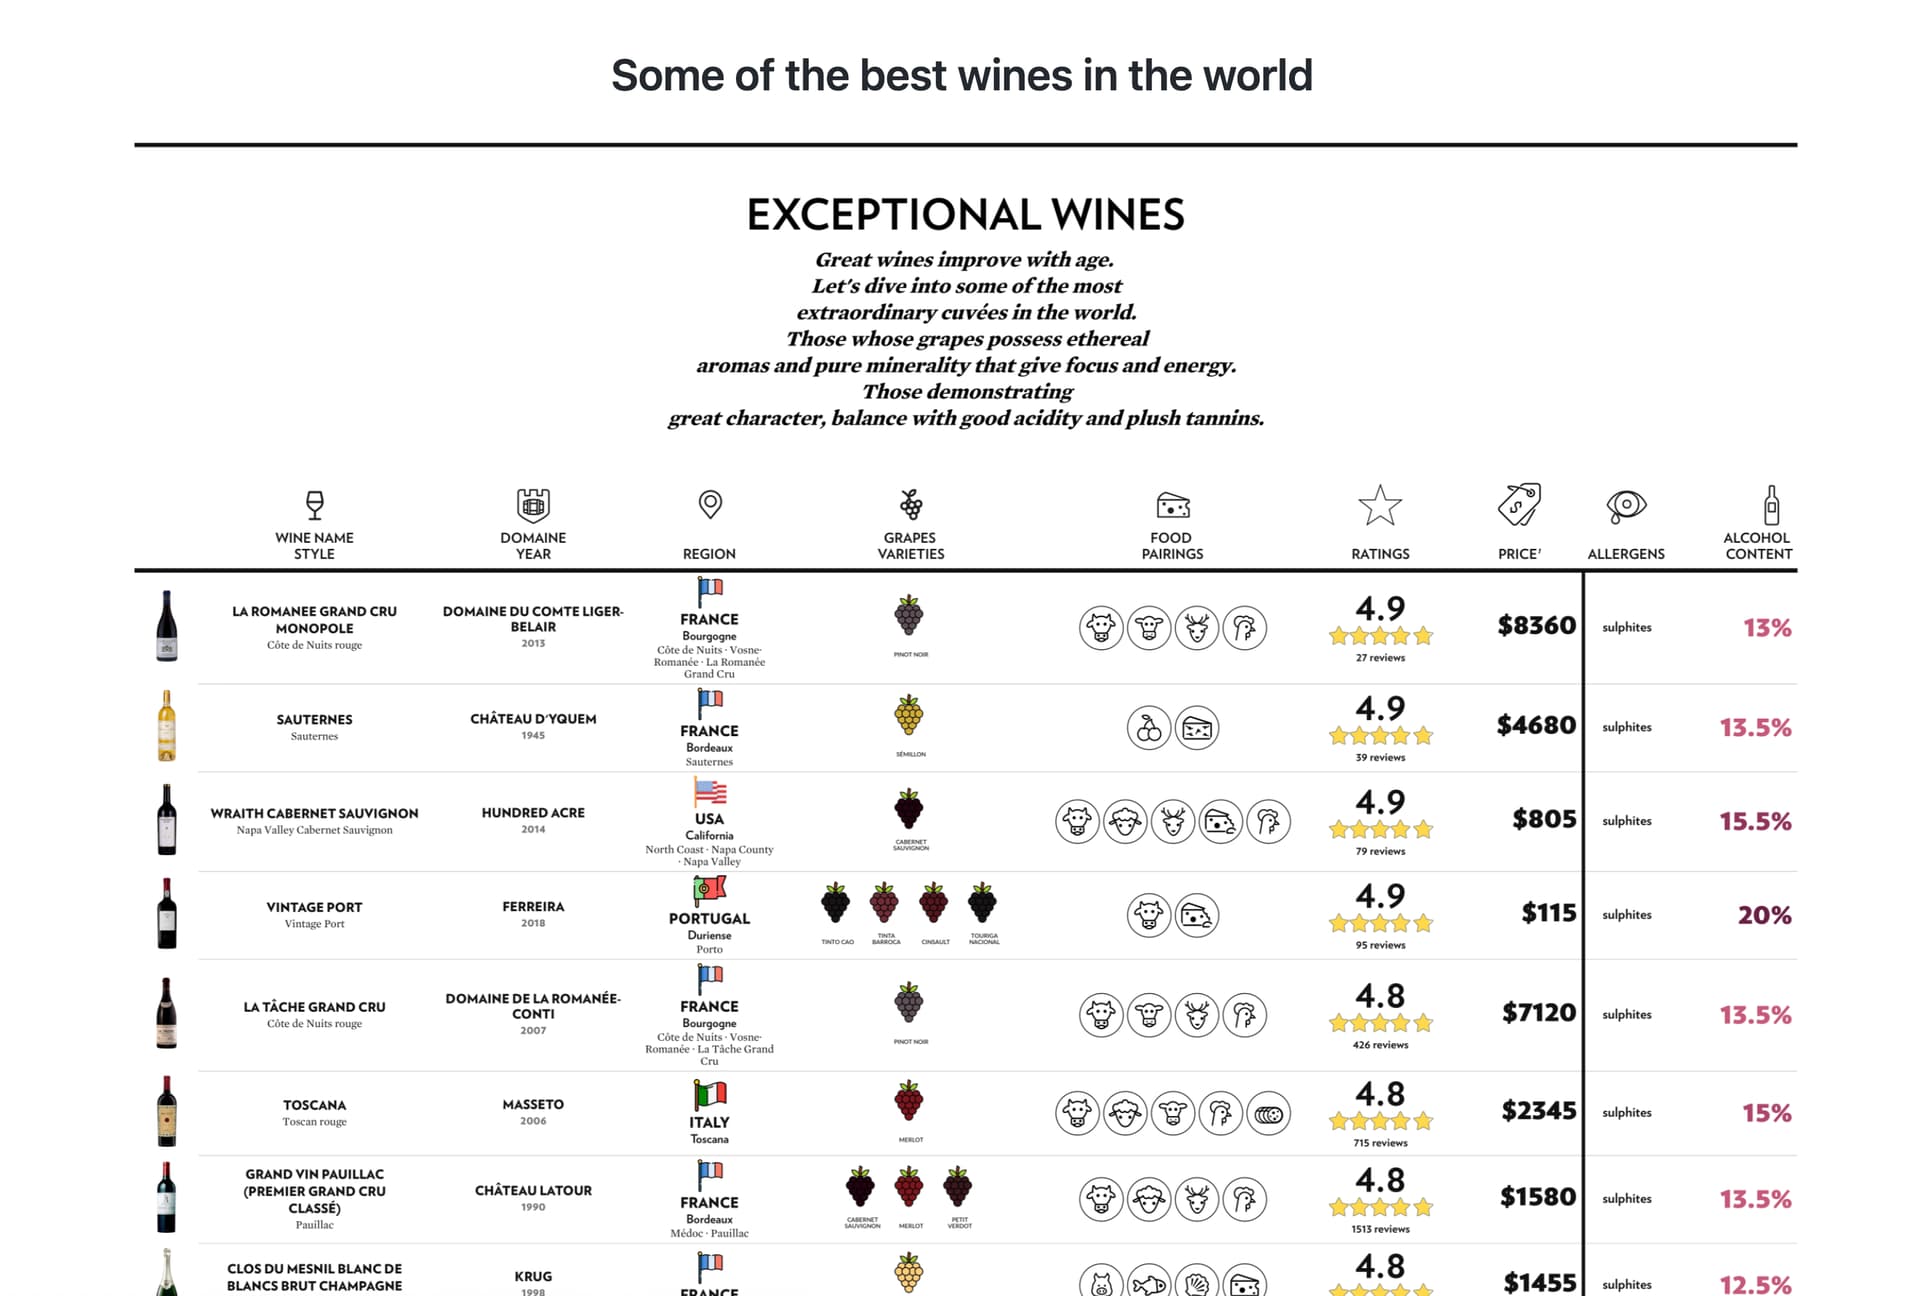
At this step, I get the different information about a wine, namely:
- its name (ex: Chablis)
- its style (ex: Burgundy Mâconnais White)
- its viticultural domain (ex: Domaine Passy le Clou)
- its grapes varieties (ex: 100 % Chardonnay)
- its region (ex: France / Bourgogne / Chablis)
- its alcohol content (ex: 14 %)
- its allergens (ex: sulphite)
- its food pairings (ex: Game, Fatty fish(Tuna, Salmon ...etc))
- its price
- its rating
- its number of reviews
- its page link (I won't use it)
- its bottle image link
On the same principle, I collect the svg descriptions of the icons of food pairings. I will use them in my table.
The complete scraping script is also located here.
If you are here, only for the table making process, don't worry, you can retrieve all the data I used for my tables in the Data Folder.
Table Making
Rating Stars
For the rating stars column, I created a rating_combo() function which takes the average rating, the number of ratings, and other parameters as arguments and returns as output a fancy star rating corresponding.
Grapes Rows
For the grape variety column, I have also developed a function which takes as parameter a string corresponding to the different grapes used in the production of a wine and which returns a corresponding html line consisting of svg of grapes filled with appropriate colors. A code mixing the {rsvg} , {whisker} and {magick} packages was used to achieve this.
Foods Icons
At this stage, I carried out the same operation as the previous one with the only difference that instead of generating the images of the grapes from a string of grapes varieties, I generate the list of food pairings from a string. CSS styling is used to form rounded borders.
Other Columns
These are images (for the bottle of wine), texts combo (example: for the name of the wine and its style), image and texts combo (example: for the regions column).
For the alcohol content column, I changed the color of the text according to the value using the cut_interval() function. Of course, I could have used the data_color() function from the {gt} package, but the rendered visual didn't please me too much.