Hello and thanks for taking a look at this application! I look forward to learning from every one else's work.
Utah Lake Water Quality Profile Dashboard
Introduction
This application is designed to interactively visualize lake profile data collected by Utah Division of Water Quality (DWQ) and cooperators and provide a platform for performing and reviewing aquatic life use based water quality assessments from lake profile data.
Data
All data used by this application are publicly available through either Utah DWQ AWQMS or the EPA's Water Quality Portal.
The data used in this application are collected as water column profiles at lake sites throughout Utah.
Lake profiles consist of measurements of dissolved oxygen, temperature, and pH at regular depth intervals through the water column. Intervals of 1 meter are typical for Utah DWQ sampling, but may be adjusted depending on the depth at any individual site. Data have been pre-processed to ensure consistency in parameter names and units and to calculate frequencies of exceedance of water quality criteria and widths of suitable habitat for fish based on areas meeting dissolved oxygen and temperature criteria for that waterbody.
Links
Deployed application
RStudio Cloud project
Features
Map-based user interface
Features are searchable by lake or site name or identification code. Click on any site location to see visualizations and data associated with that site. Plots are most interesting for deep lakes with relatively high sampling frequency. For example, try searching "Jordanelle Reservoir," then clicking through sites and parameters to identify sites, dates, and portions of the water column for which water quality criteria are met.
Multiple ways to interact with data
Users can view both plots and tables of data encompassing multiple time scales. Water quality data collected at a monitoring location can be summarized through time on the "Time series" tab. Or, users can examine data from any individual sampling event on the "Individual profiles" tab.
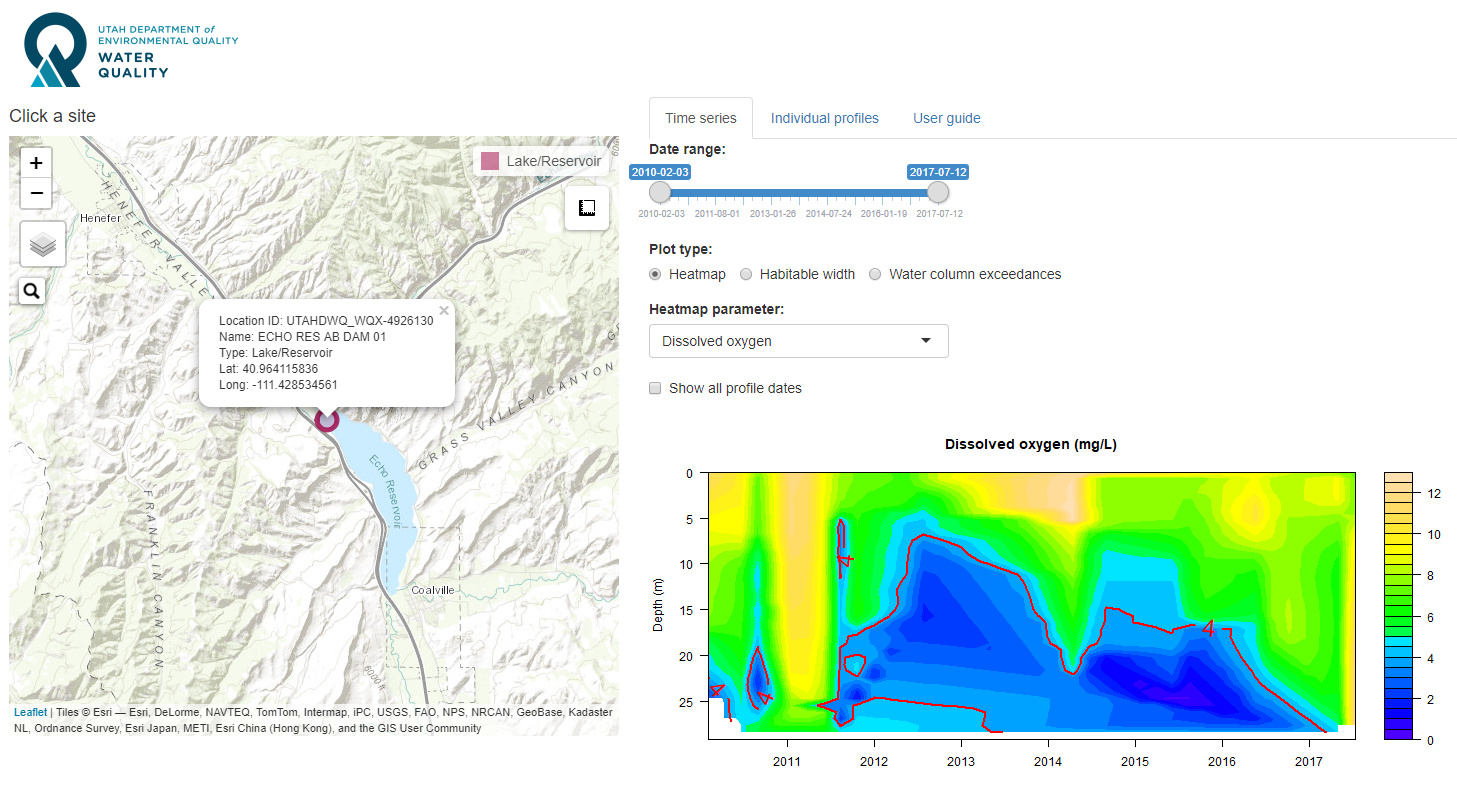
Screenshot
Example dissolved oxygen time series heatmap
More information
The application includes an embedded user guide. See the "User guide" tab in the application for more information.