What can I detect on this Exploratory Data Analysis for theses continuos variables?
library("dplyr")
library("DataExplorer")
I have the following dataset: myds :
glimpse(myds)
## Observations: 841,500
## Variables: 6
## $ score                  <dbl> 0, 0, 0, 0, 0, 0, 0, 0, 0, 0, 0, 0, 0, ...
## $ amount_sms_received    <int> 0, 0, 0, 0, 0, 0, 3, 0, 0, 3, 0, 0, 0, ...
## $ amount_emails_received <int> 3, 36, 3, 12, 0, 63, 9, 6, 6, 3, 0, 0, ...
## $ distance_from_server   <int> 17, 17, 7, 7, 7, 14, 10, 7, 34, 10, 7, ...
## $ age                    <int> 17, 44, 16, 16, 30, 29, 26, 18, 19, 43,...
## $ points_earned          <int> 929, 655, 286, 357, 571, 833, 476, 414,...
summary(myds)
##      score         amount_sms_received amount_emails_received
##  Min.   :  0.000   Min.   :0.0000      Min.   : 0.00
##  1st Qu.:  0.000   1st Qu.:0.0000      1st Qu.: 0.00
##  Median :  0.000   Median :0.0000      Median : 6.00
##  Mean   :  0.292   Mean   :0.2243      Mean   :13.08
##  3rd Qu.:  0.000   3rd Qu.:0.0000      3rd Qu.:18.00
##  Max.   :725.700   Max.   :3.0000      Max.   :63.00
##  distance_from_server      age        points_earned
##  Min.   :  7.00       Min.   :13.00   Min.   : 286.0
##  1st Qu.:  7.00       1st Qu.:22.00   1st Qu.: 381.0
##  Median : 17.00       Median :29.00   Median : 464.0
##  Mean   : 25.54       Mean   :29.21   Mean   : 554.8
##  3rd Qu.: 21.00       3rd Qu.:36.00   3rd Qu.: 655.0
##  Max.   :345.00       Max.   :62.00   Max.   :2857.0
Goal
Do an Exploratory Data Analysis (EDA) including different Unsupervised Analyses techniques in order to select the right variables for the Supervised Analysis which will be done with Neural Networks (NN) . The variable to predict will be: score .
References
Facts
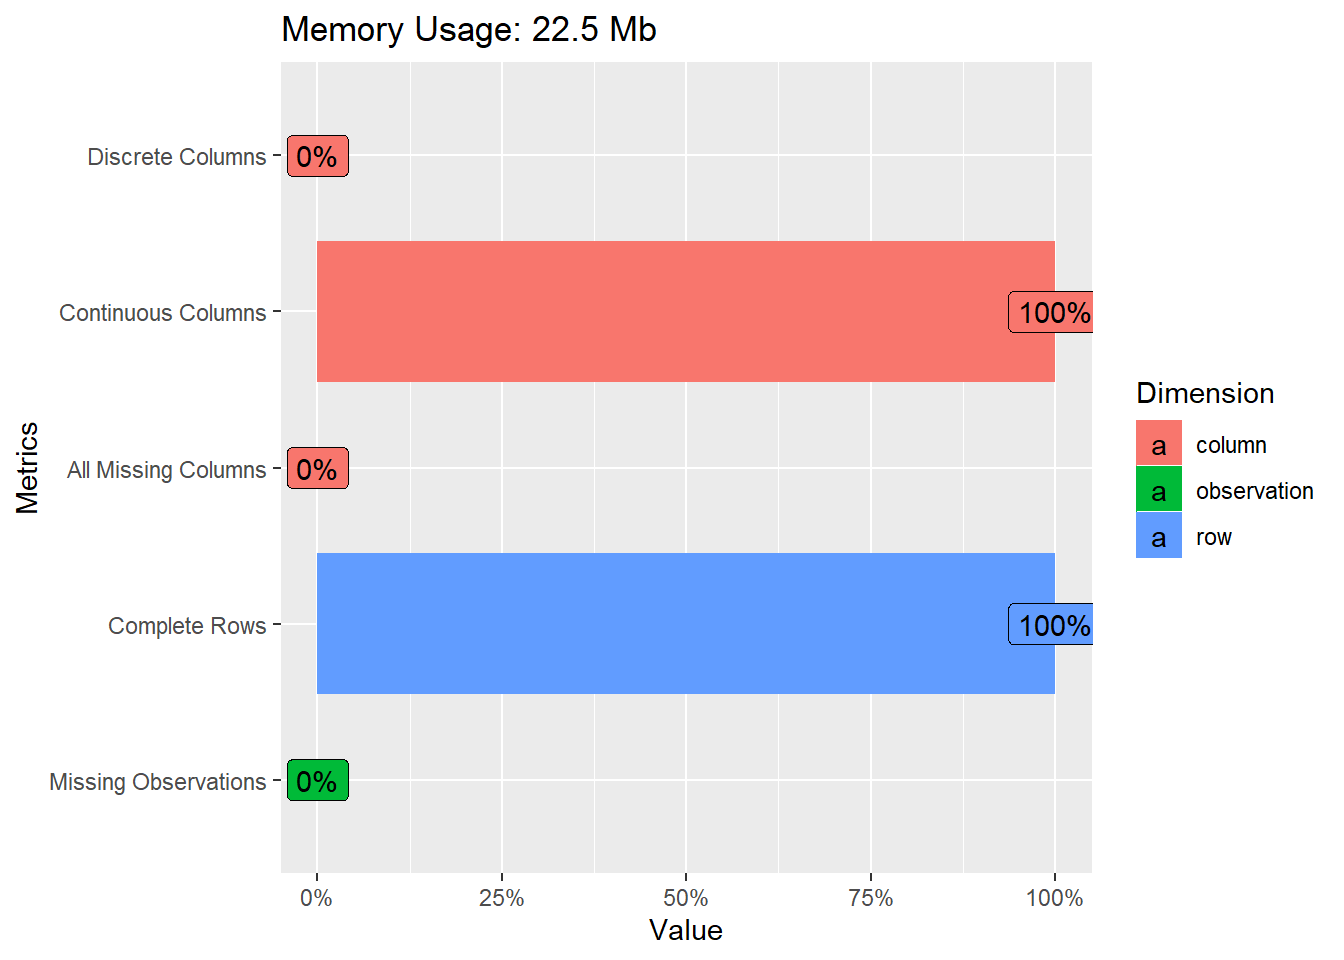
Some overall information about the dataset:
introduce(myds)
##     rows columns discrete_columns continuous_columns all_missing_columns
## 1 841500       6                0                  6                   0
##   total_missing_values complete_rows total_observations memory_usage
## 1                    0        841500            5049000     23564232
plot_intro(myds)
Additional Info:
nr1 = nrow(myds)
nr2 = nrow(myds[myds$score != 0,])
nr1
## [1] 841500
nr2
## [1] 2160
cat(sprintf('Ratio of values under: "Score" different than 0: %.4f', nr2/nr1))
## Ratio of values under: "Score" different than 0: 0.0026
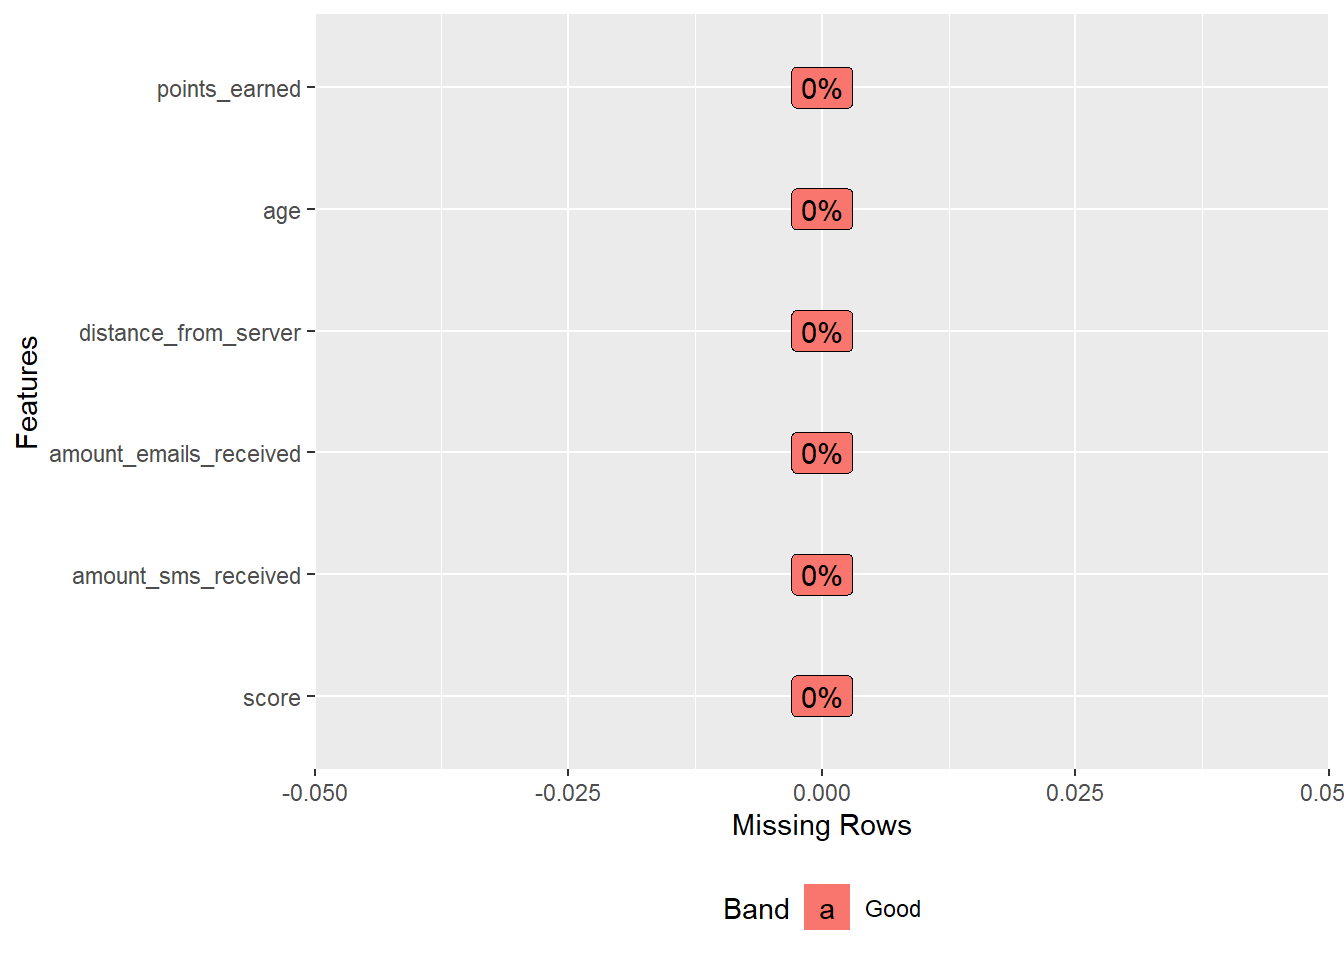
Missing values:
plot_missing(myds)
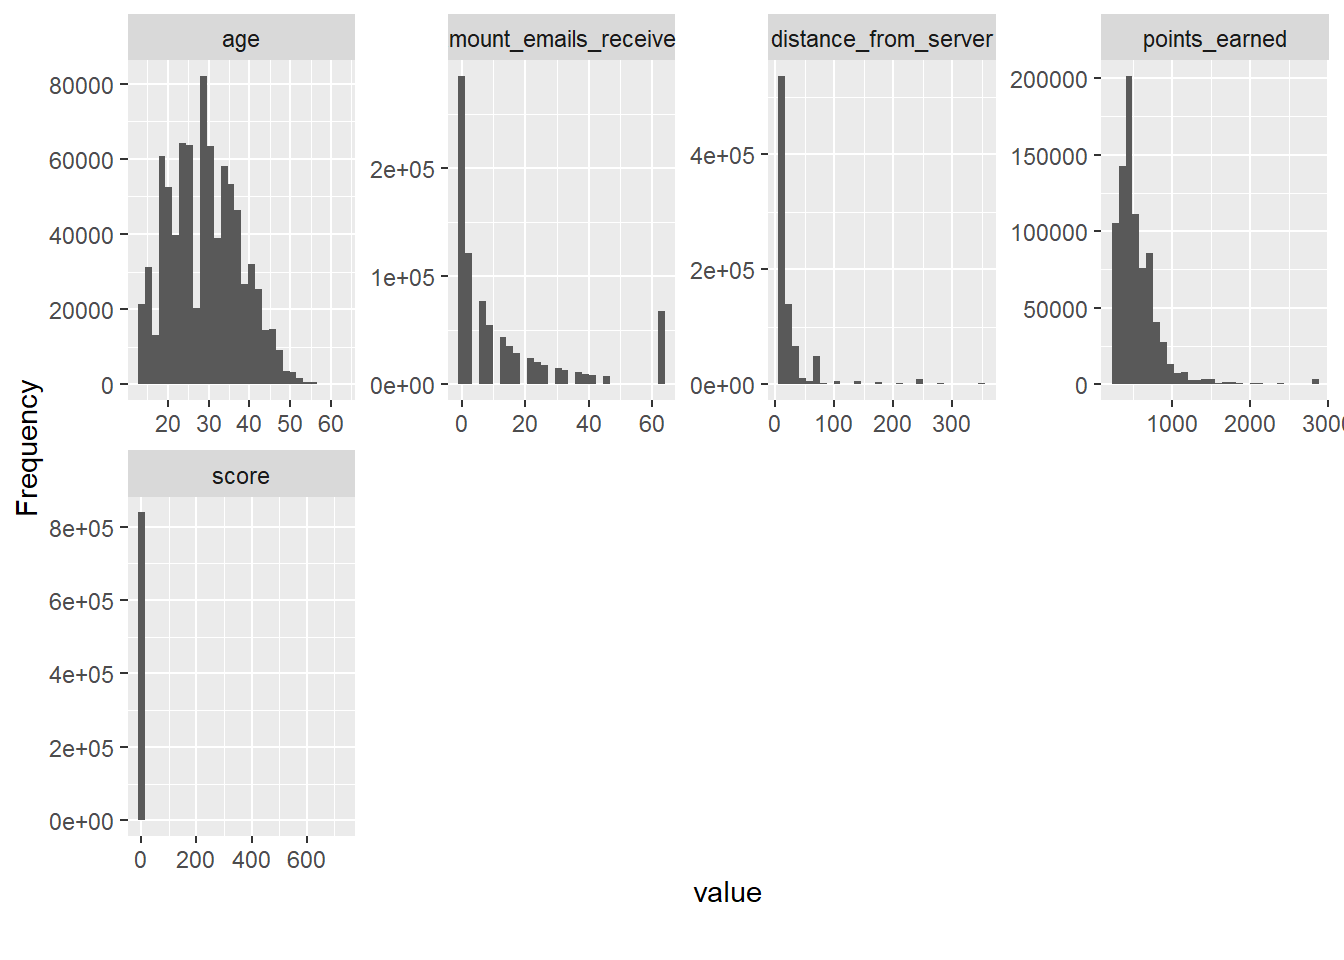
Histograms:
plot_histogram(myds)
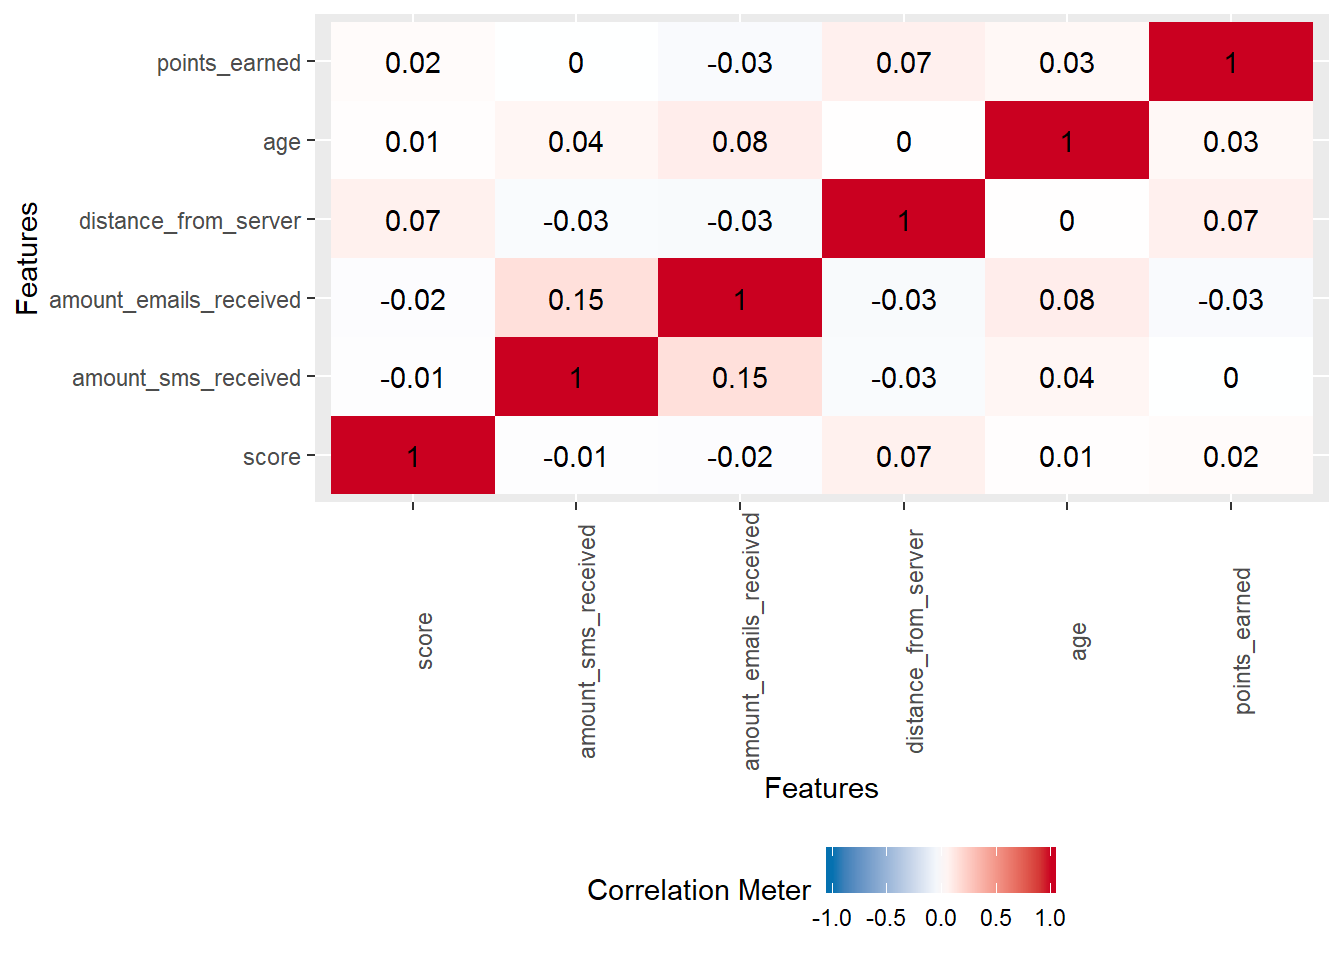
Correlations:
plot_correlation(myds)
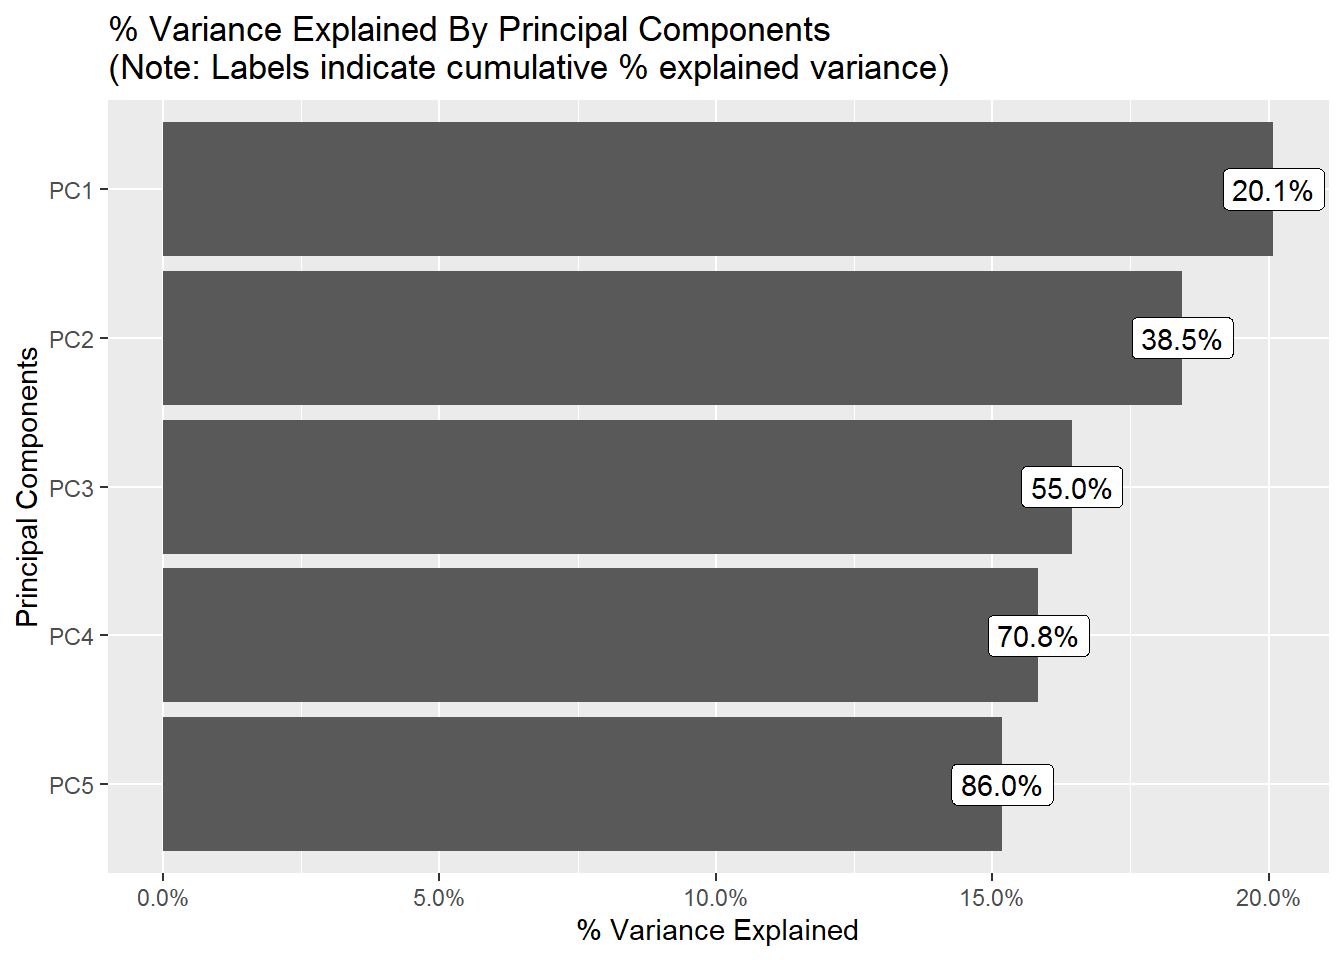
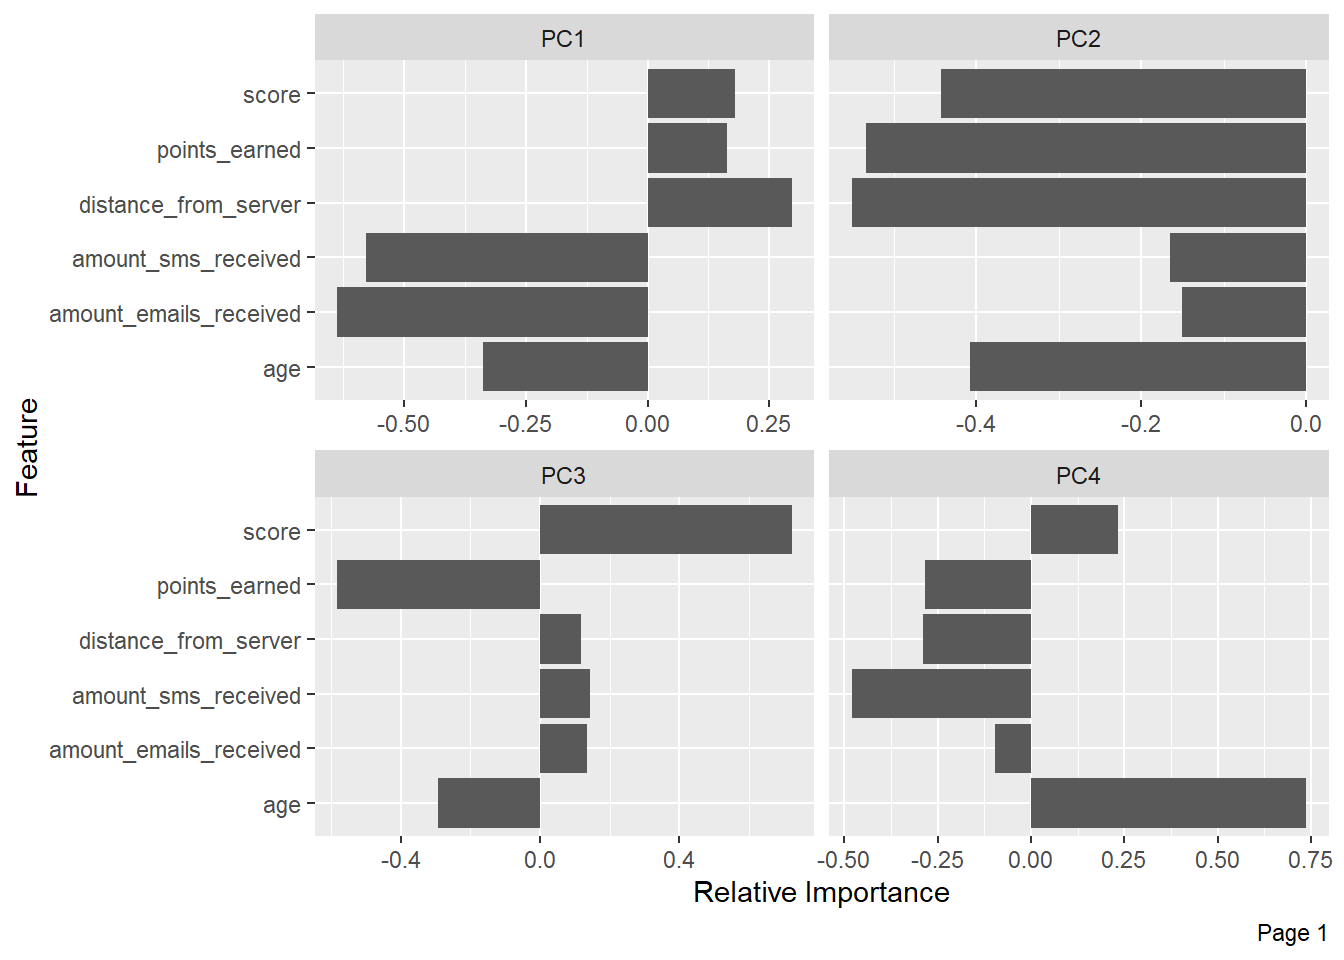
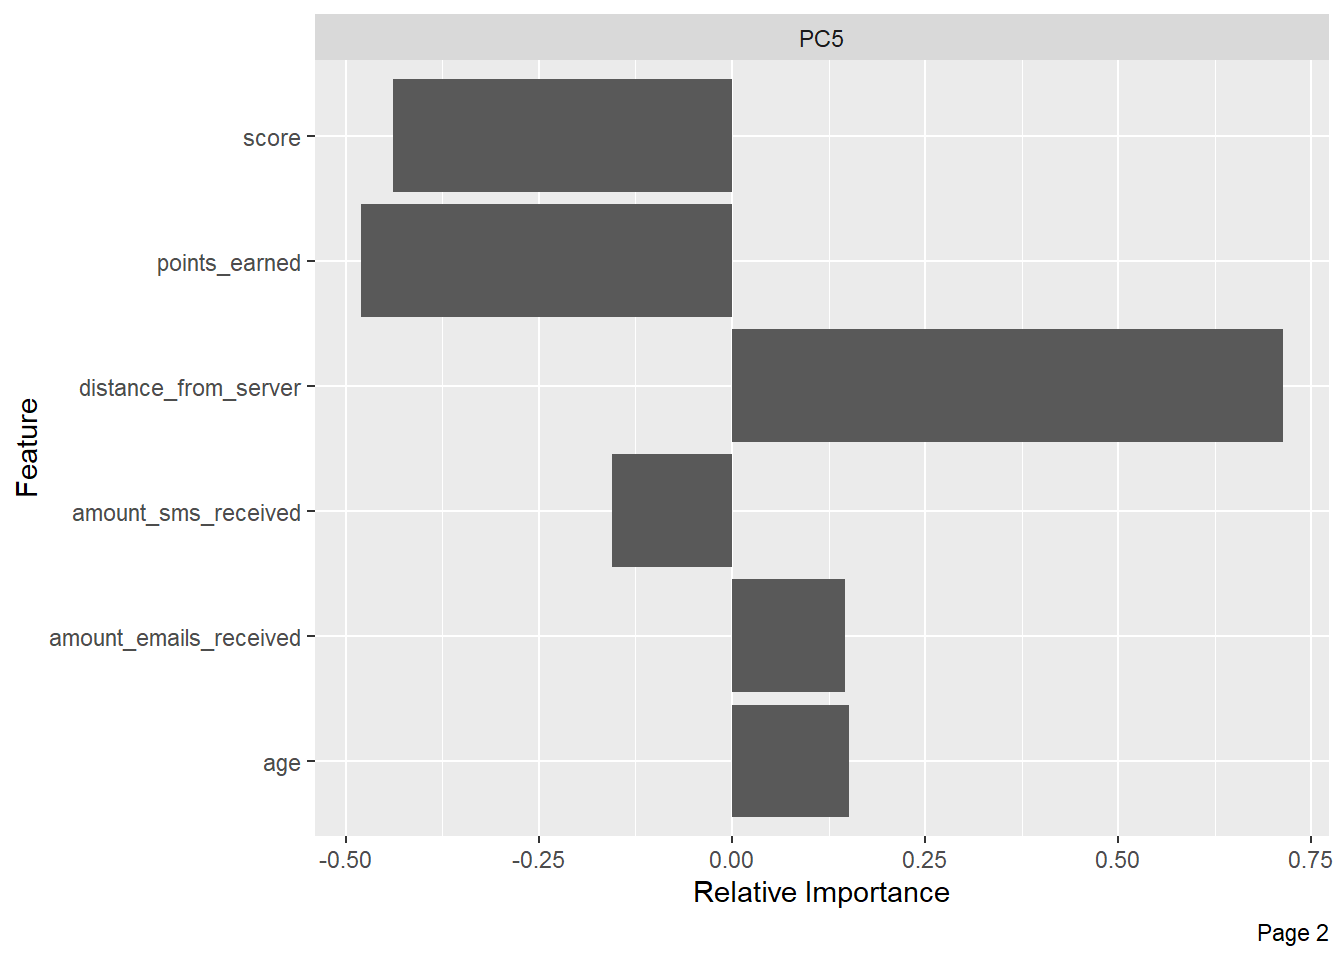
Principal Component Analysis (PCA):
plot_prcomp(myds, variance_cap = 0.9, nrow = 2L, ncol = 2L)
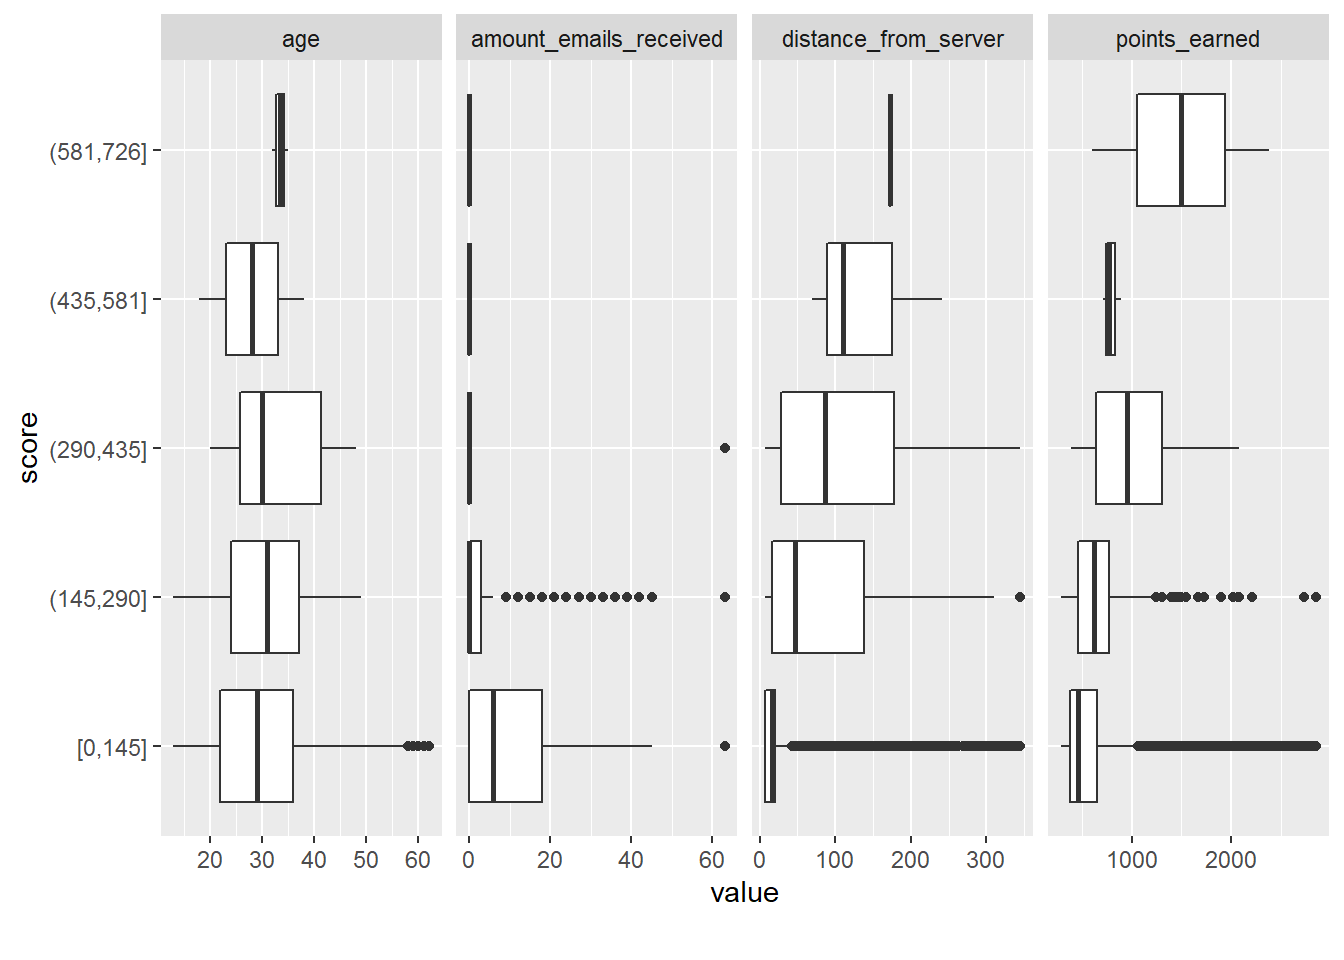
Boxplots:
plot_boxplot(myds, by = "score")
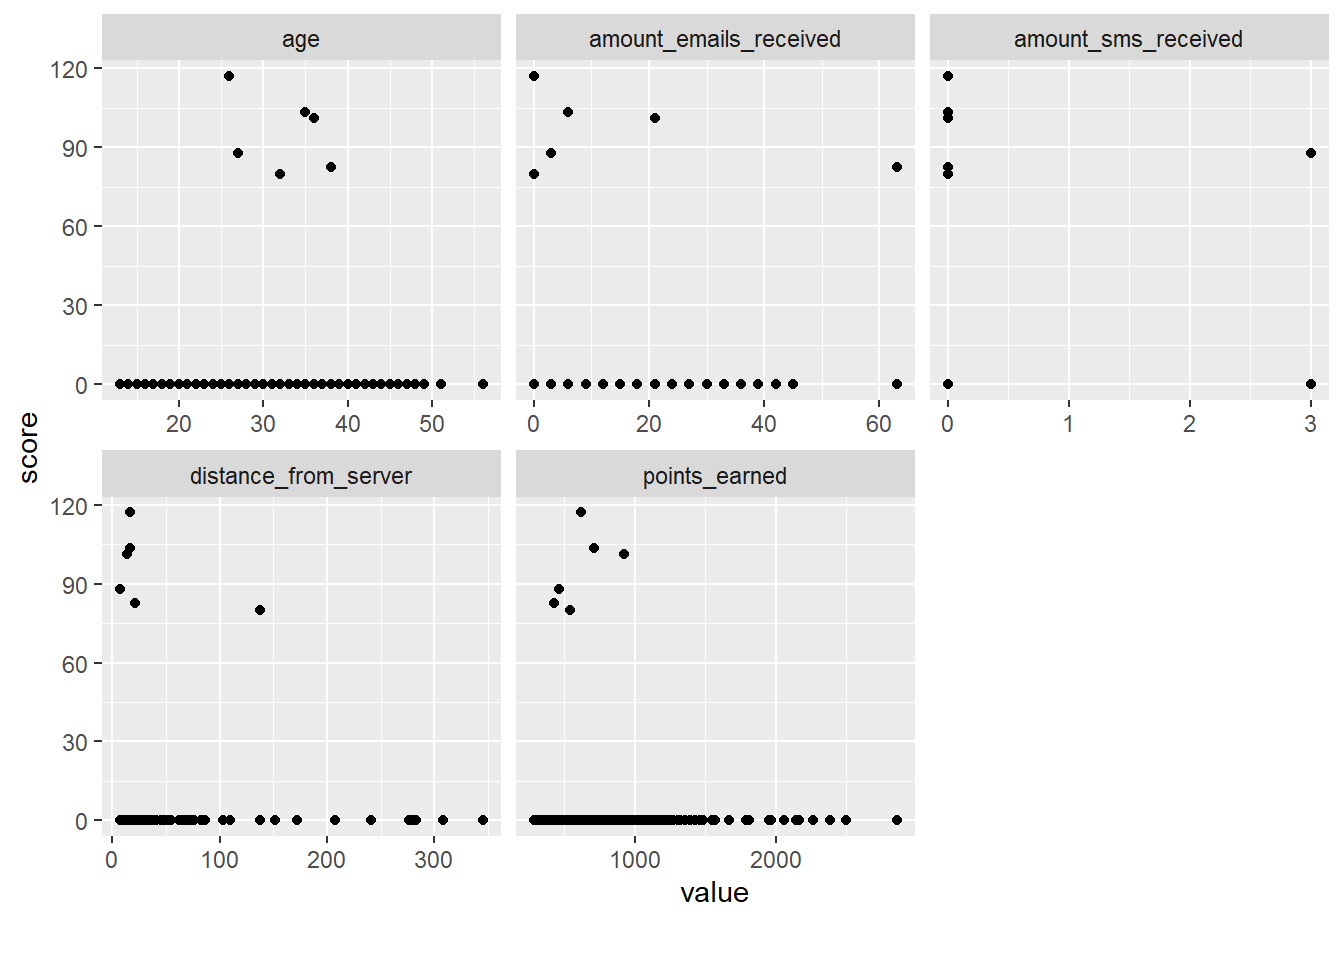
Scatterplots:
plot_scatterplot(myds, by = "score", sampled_rows = 2000L)
My Questions:
- What variables make more sense to be selected in order to train my
Neural Networks? - Is any of the plots above giving useful information?
- What are your general thoughts about the information gathered above?
Thanks!