Authors: David Smale - github - twitter - LinkedIn
View the Full Tutorial - Code reproducing table - Full Repo
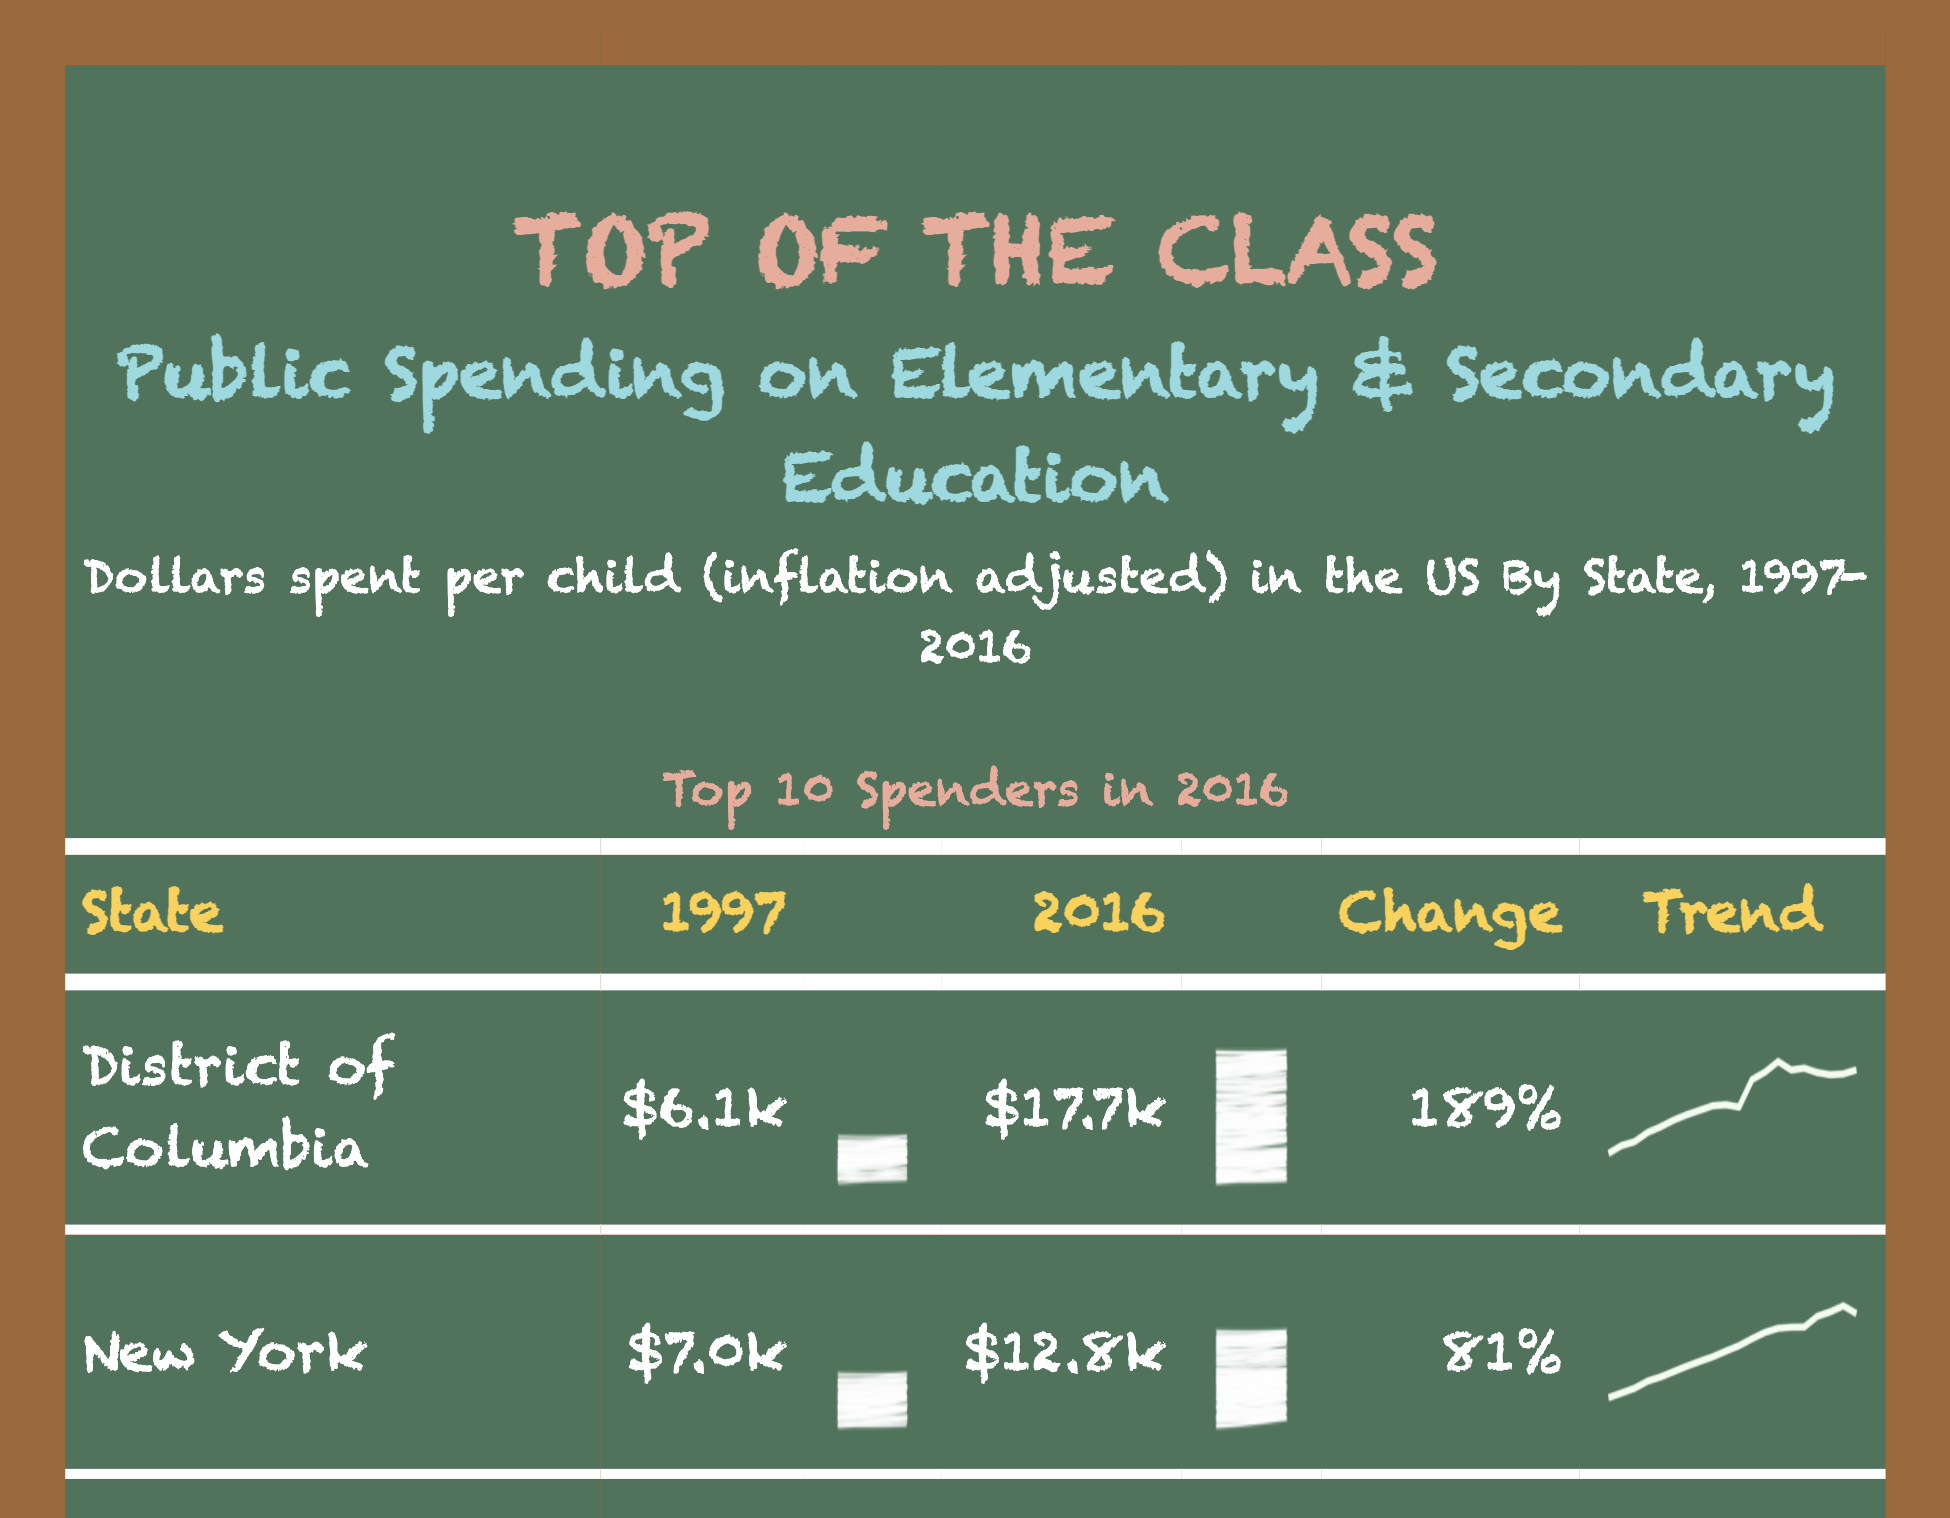
A gt table, customised to look like a school chalkboard, which shows changes in public spending on Elementary and Secondary Schools in the US from 1997 to 2016. The submission is in the form of a tutorial which walks through some techniques for customising a gt table.
Ever wanted to make a table look like it was written on a school chalkboard, without, y'know, actually writing on a school chalkboard? In this tutorial I walk through some techniques for customising a gt table. Along with changing fonts and colours, and adding a border, I also show how ggplot2 plots can be included in your tables. This was my first time using gt, and hopefully I've stumbled across some things that others will find useful. Because as they say, everyday is a school day!
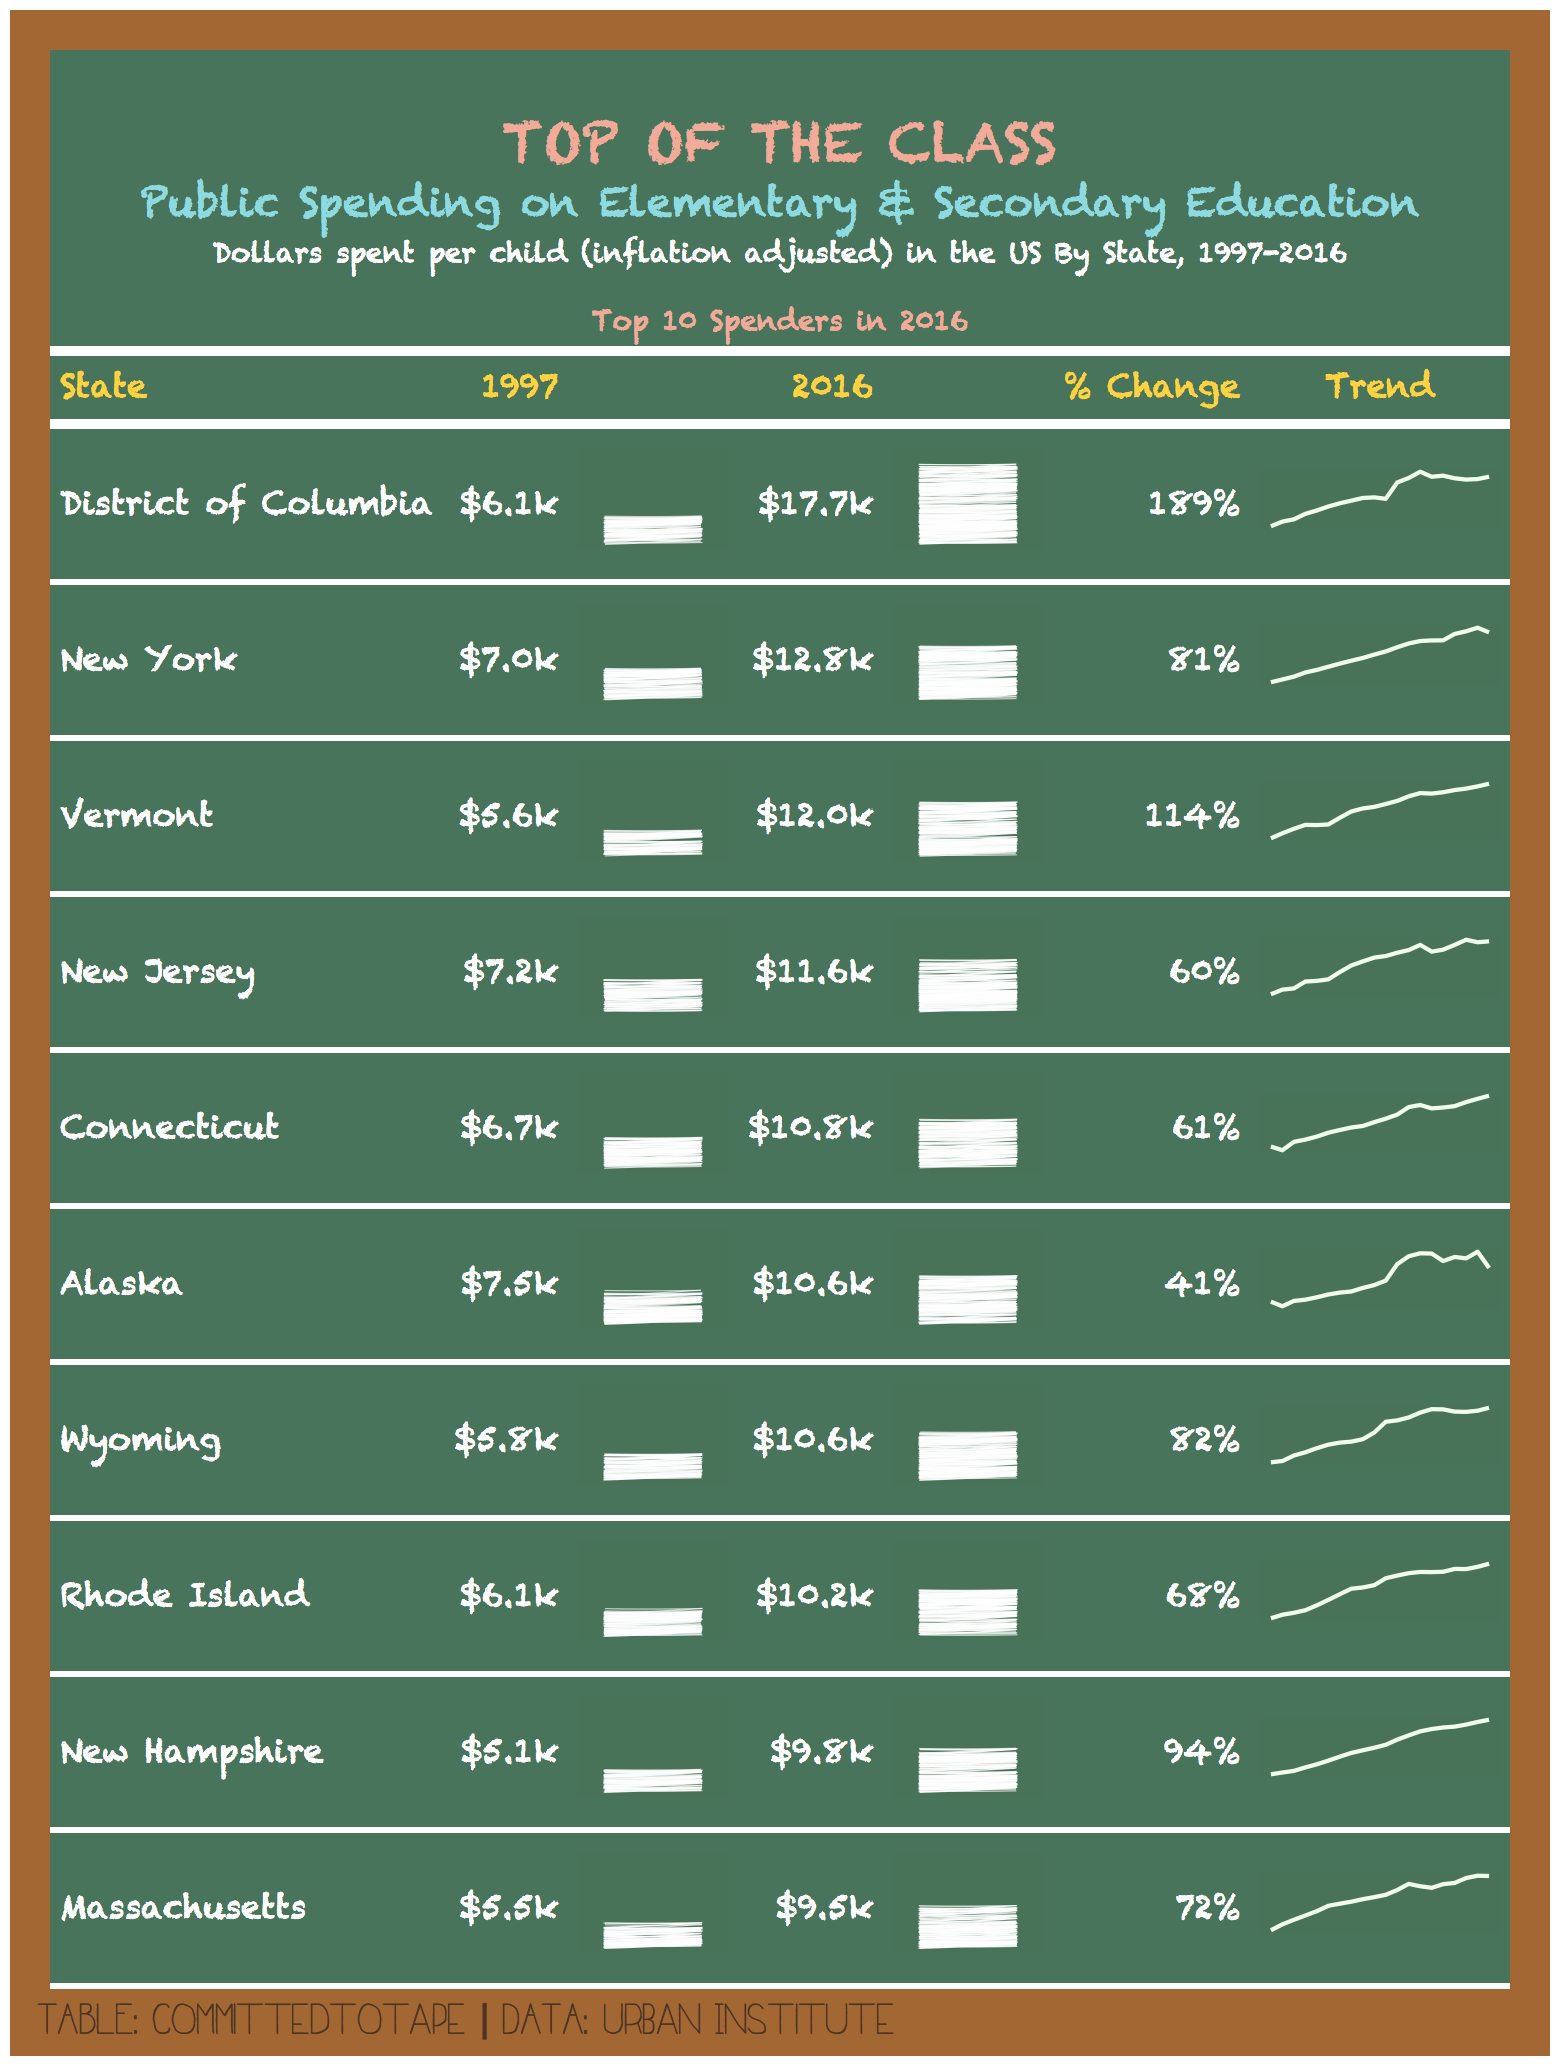
Spending on Education - Chalkboard Table
Sometimes you just need a little nudge before delving into something new, and sometimes that little nudge is a RStudio competition. Last year I finally gave Shiny ago after seeing RStudio announce the first ever Shiny contest - and things worked out pretty well! So here I am again to try and repeat the trick, but this time - it’s tables!
In this post I’ll be using the gt package to render a table in HTML. There are several packages in R for creating tables, but I was drawn to gt (which is short for the grammar of tables) because of my love for ggplot2 (the grammar of graphics) and their shared philosophy of building output layer by layer, with the flexibility to customise the output.
For the full code to reproduce the below, go to this repo on Github: GitHub - committedtotape/education-spending: Building a table with the {gt} package, for entry into the RStudio Table Contest.
For a great introduction to the basics of gt , look no further than Thomas Mock’s blogpost, and check out his other posts on building tables in R while you’re at it! I’ll skip over some of the core building blocks that Thomas has covered, as I want to mainly focus on ways to customise a table to give it that little bit extra!
Dive into the rest of the detailed tutorial at
https://davidsmale.netlify.app/portfolio/spending-on-education/