Author: Ryo Nakagawara - github - Twitter - webiste
View the Tutorial blog post - Table Example - Repo
Introduction
I started out in soccer analytics mainly to practice my data cleaning and visualization skills and over time it evolved into an entire portfolio of plots and graphs that you can see in the soccer_ggplots Github Repo. At the beginning of last season (summer of 2019) I figured out how to grab match-level data from understat.com via Ewen Henderson’s {understatr} package and started creating a “match day summary graphic”. These were intended to visualize the data understat.com provided in my own aesthetically-pleasing way for the general public (mainly on soccer analytics Twitter). These aren’t intended for coaches/clubs but are more media/fan oriented pieces to help convey the flow of the match in a different way than the usual box scores (number of shots, tackles, yellow cards, total passes, etc.).
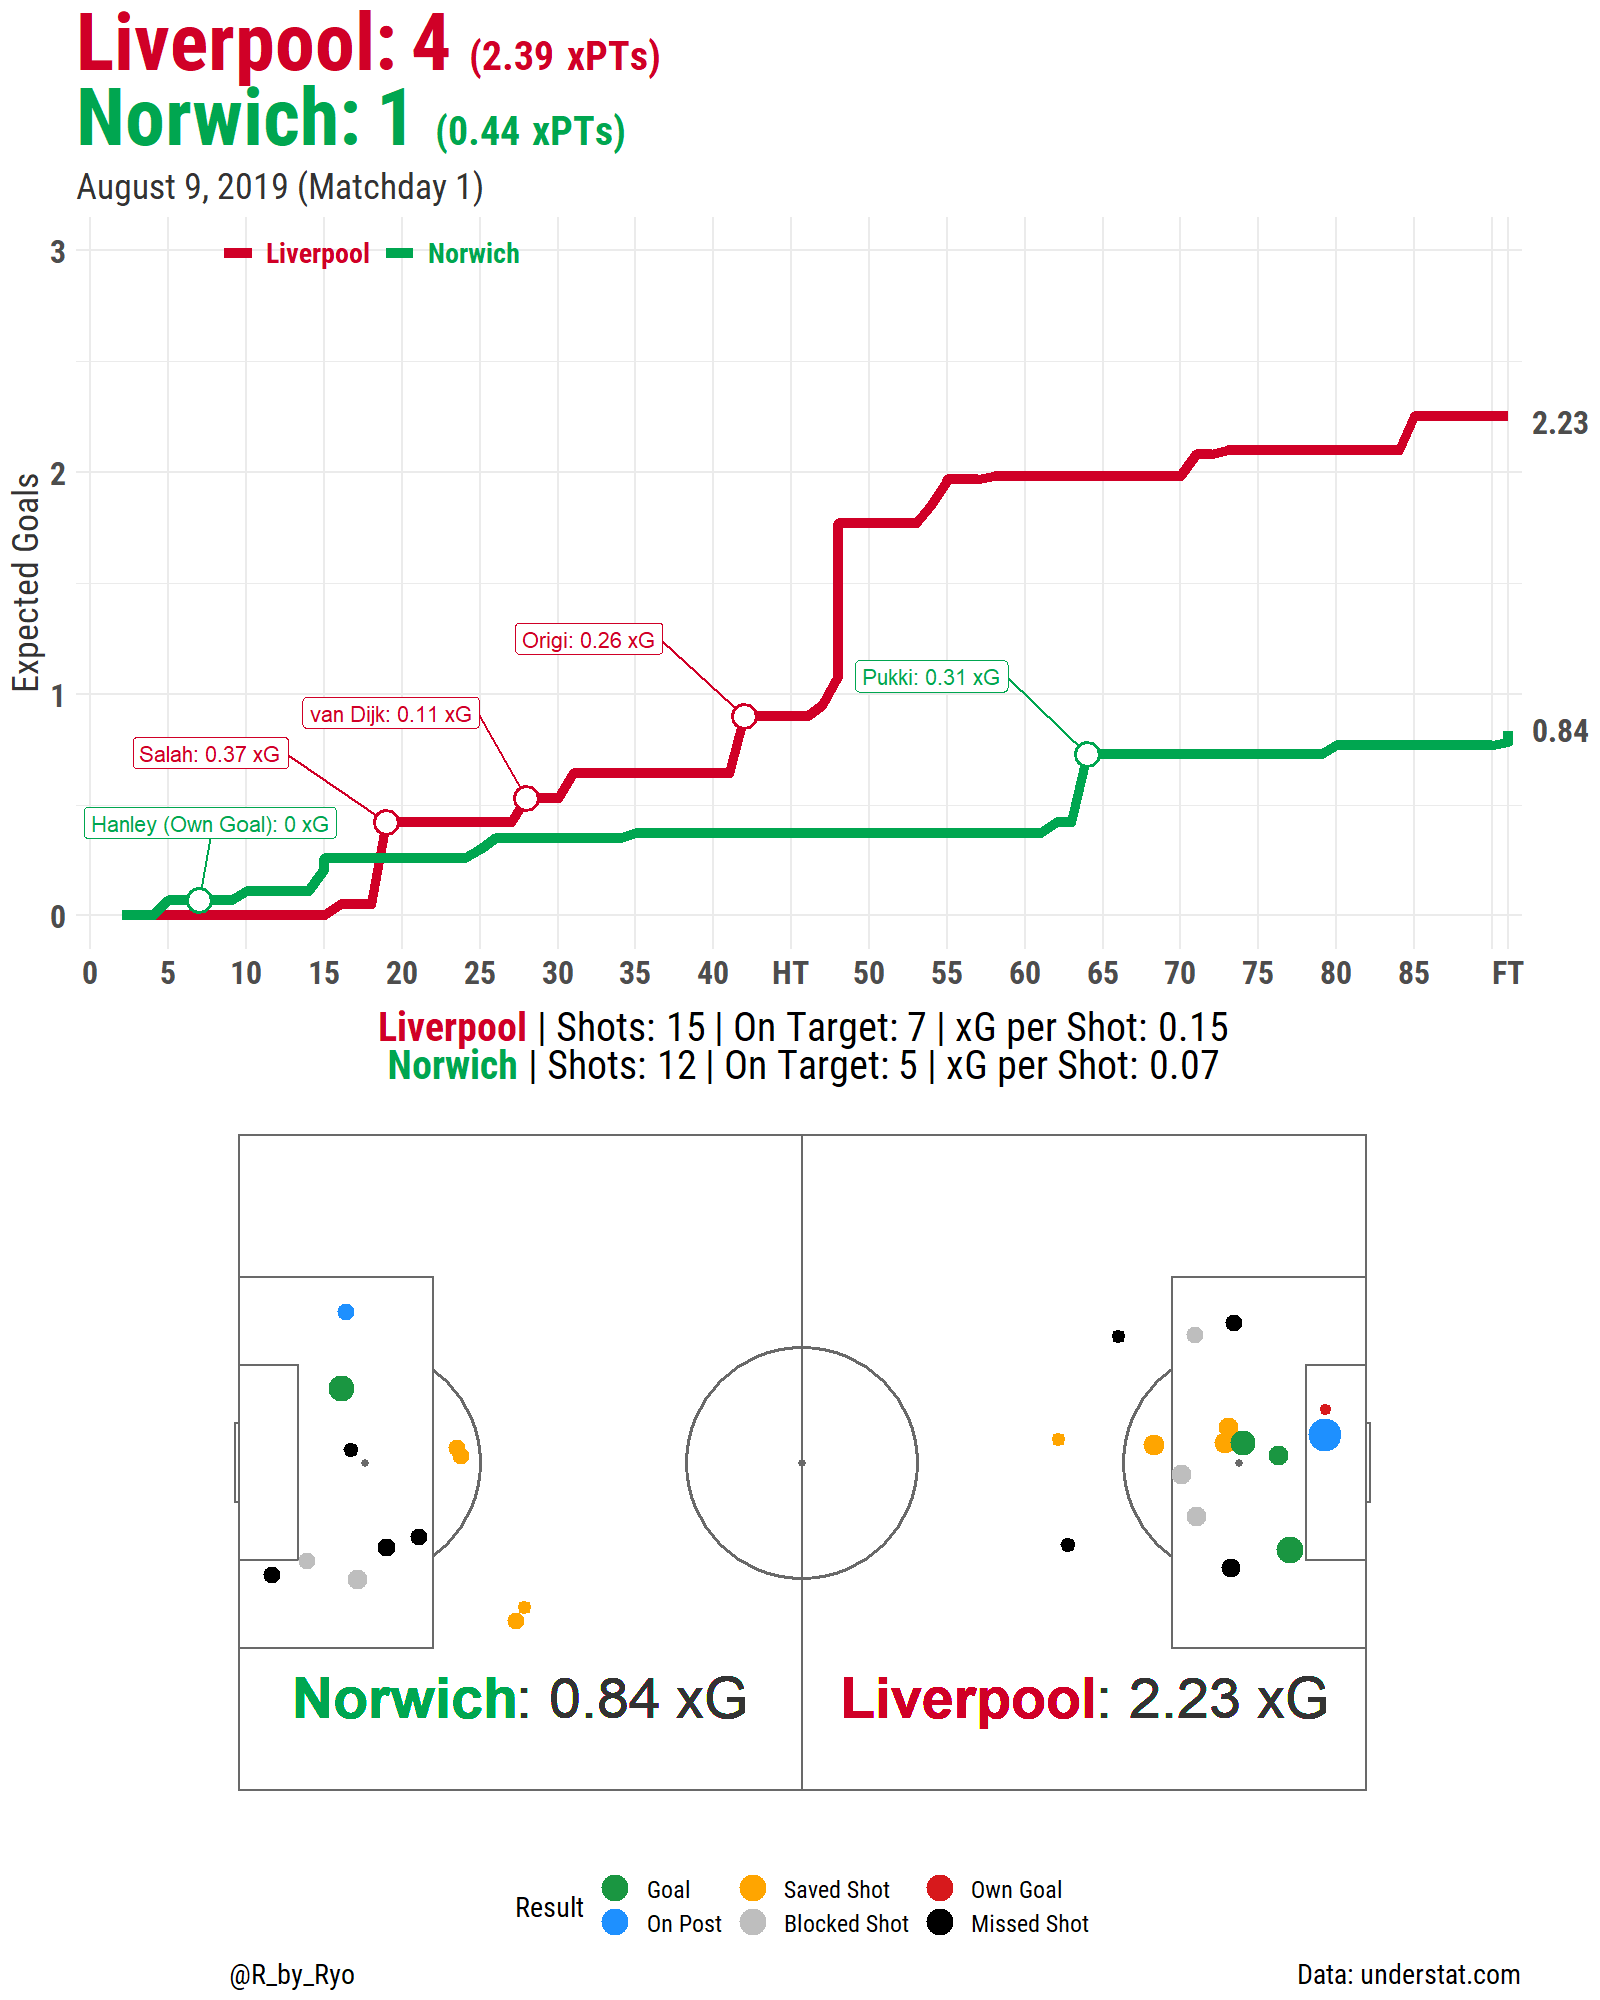
Version 1 (last year) looked like this:
In the past few months, after the Corona-extended-season ended, I intended to make tweaks to the graph above but instead I just started creating other viz with the data available while also incorporating some other stuff that I couldn’t fit into the original match day viz.
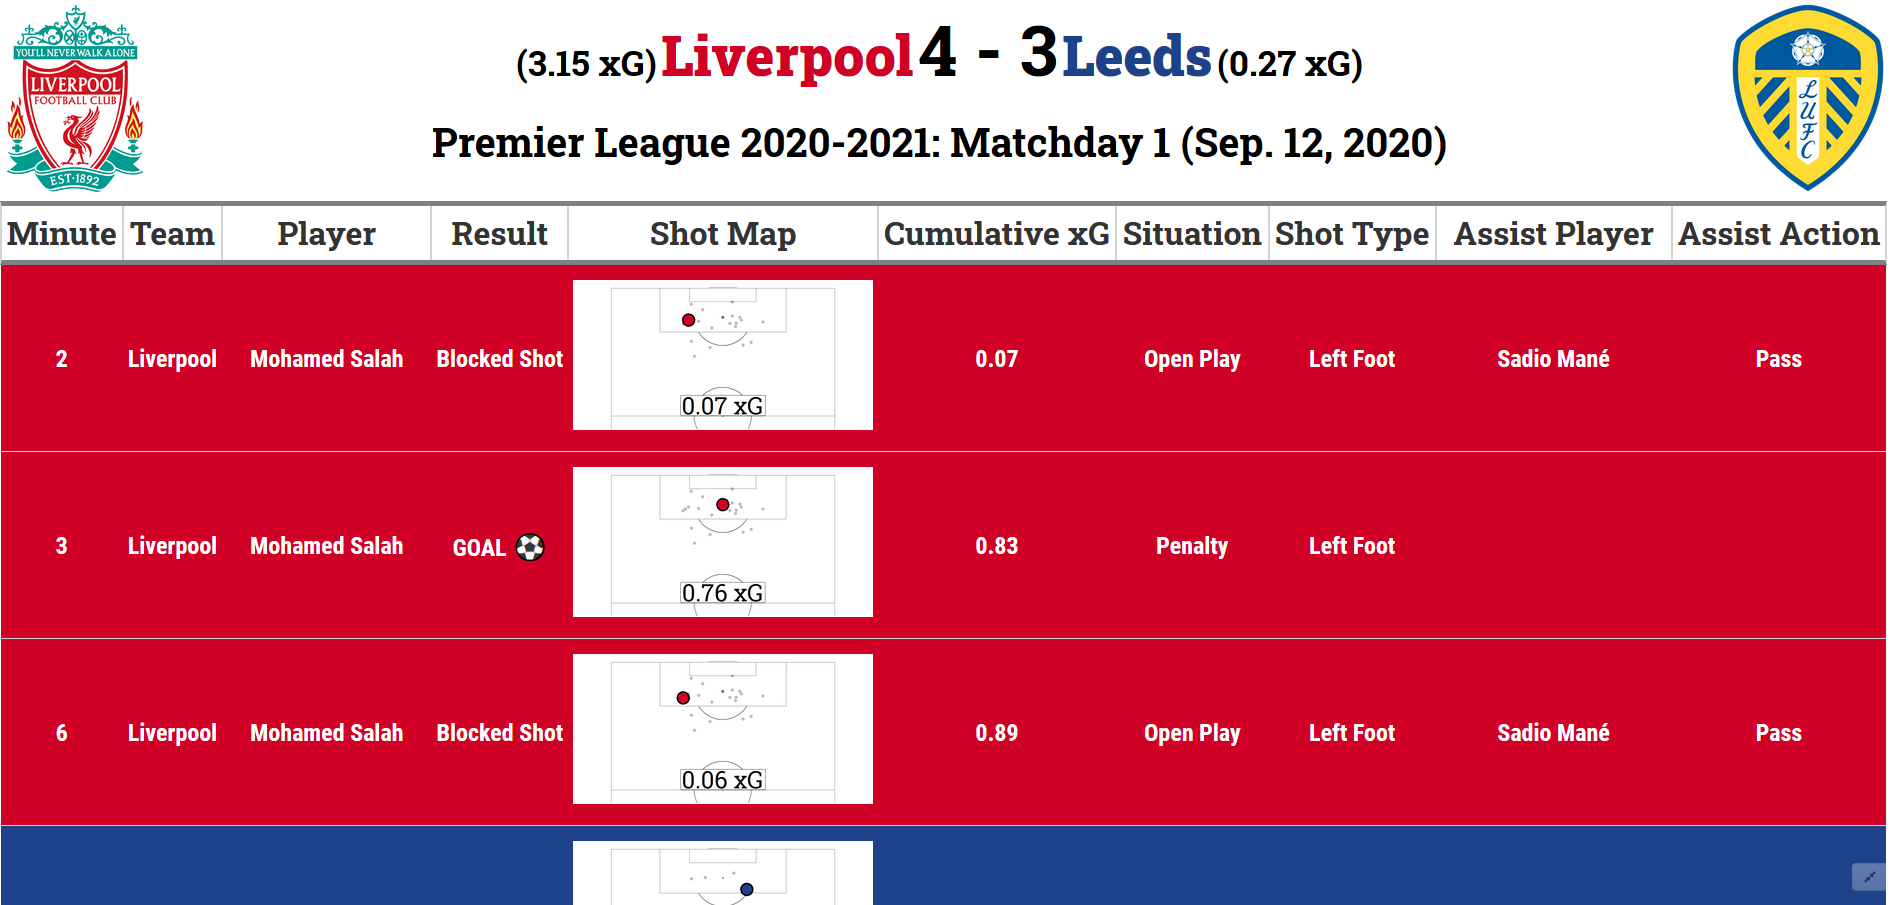
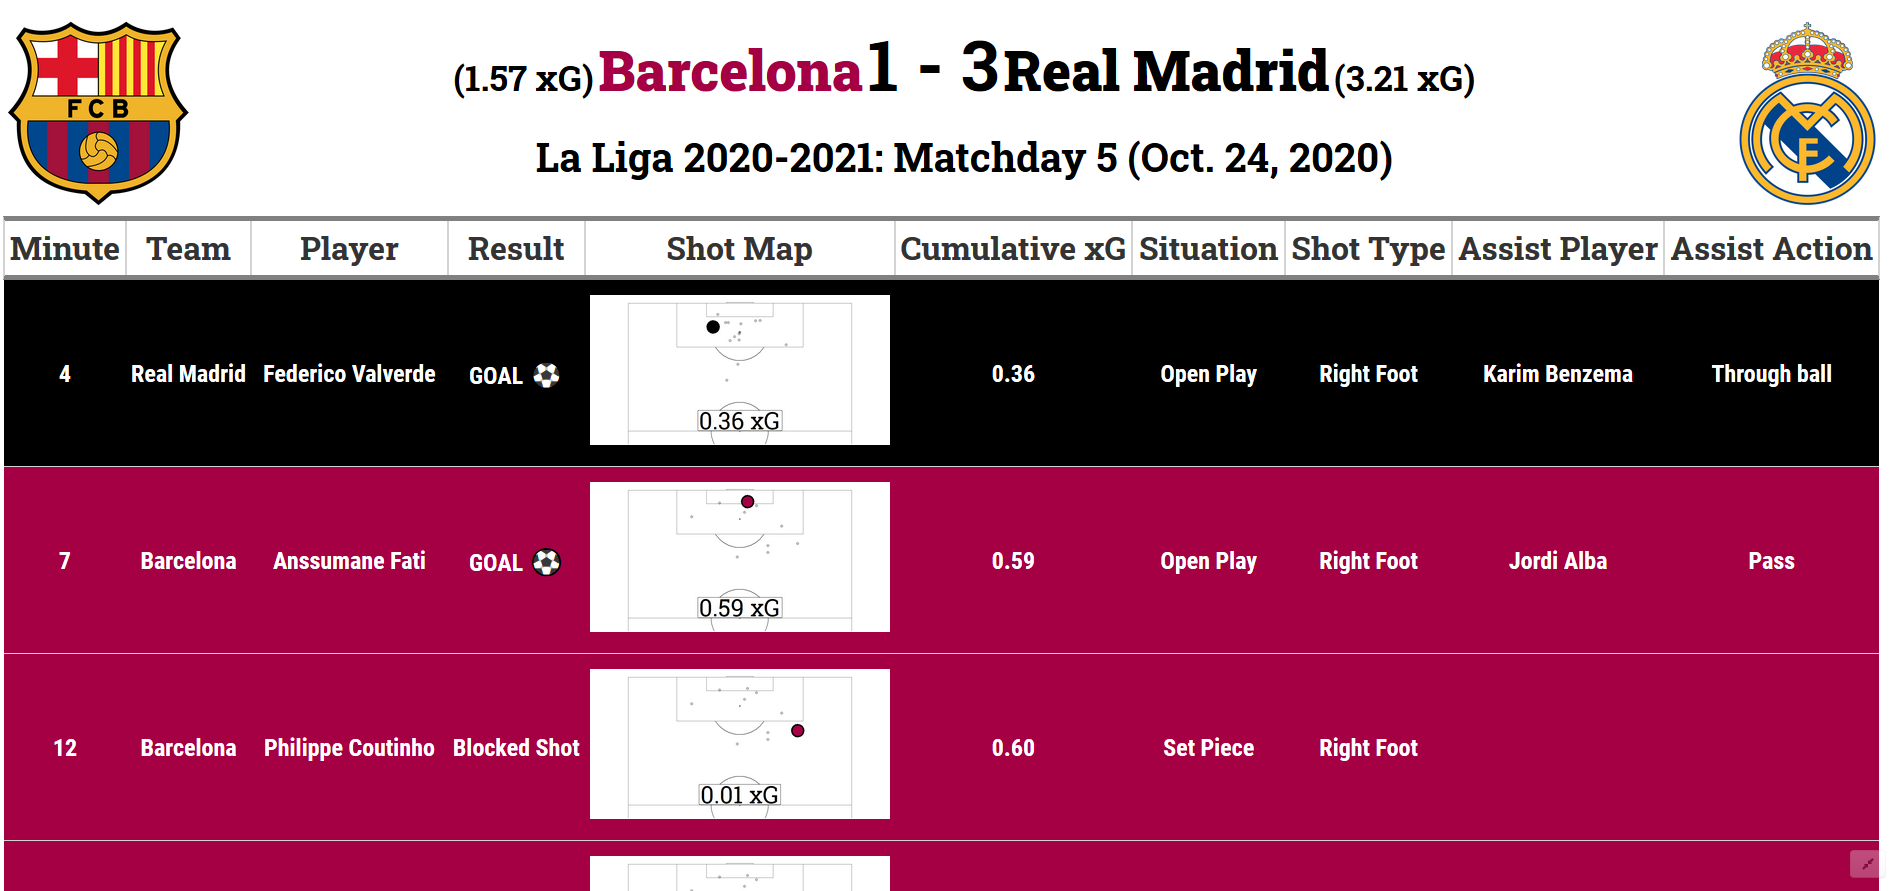
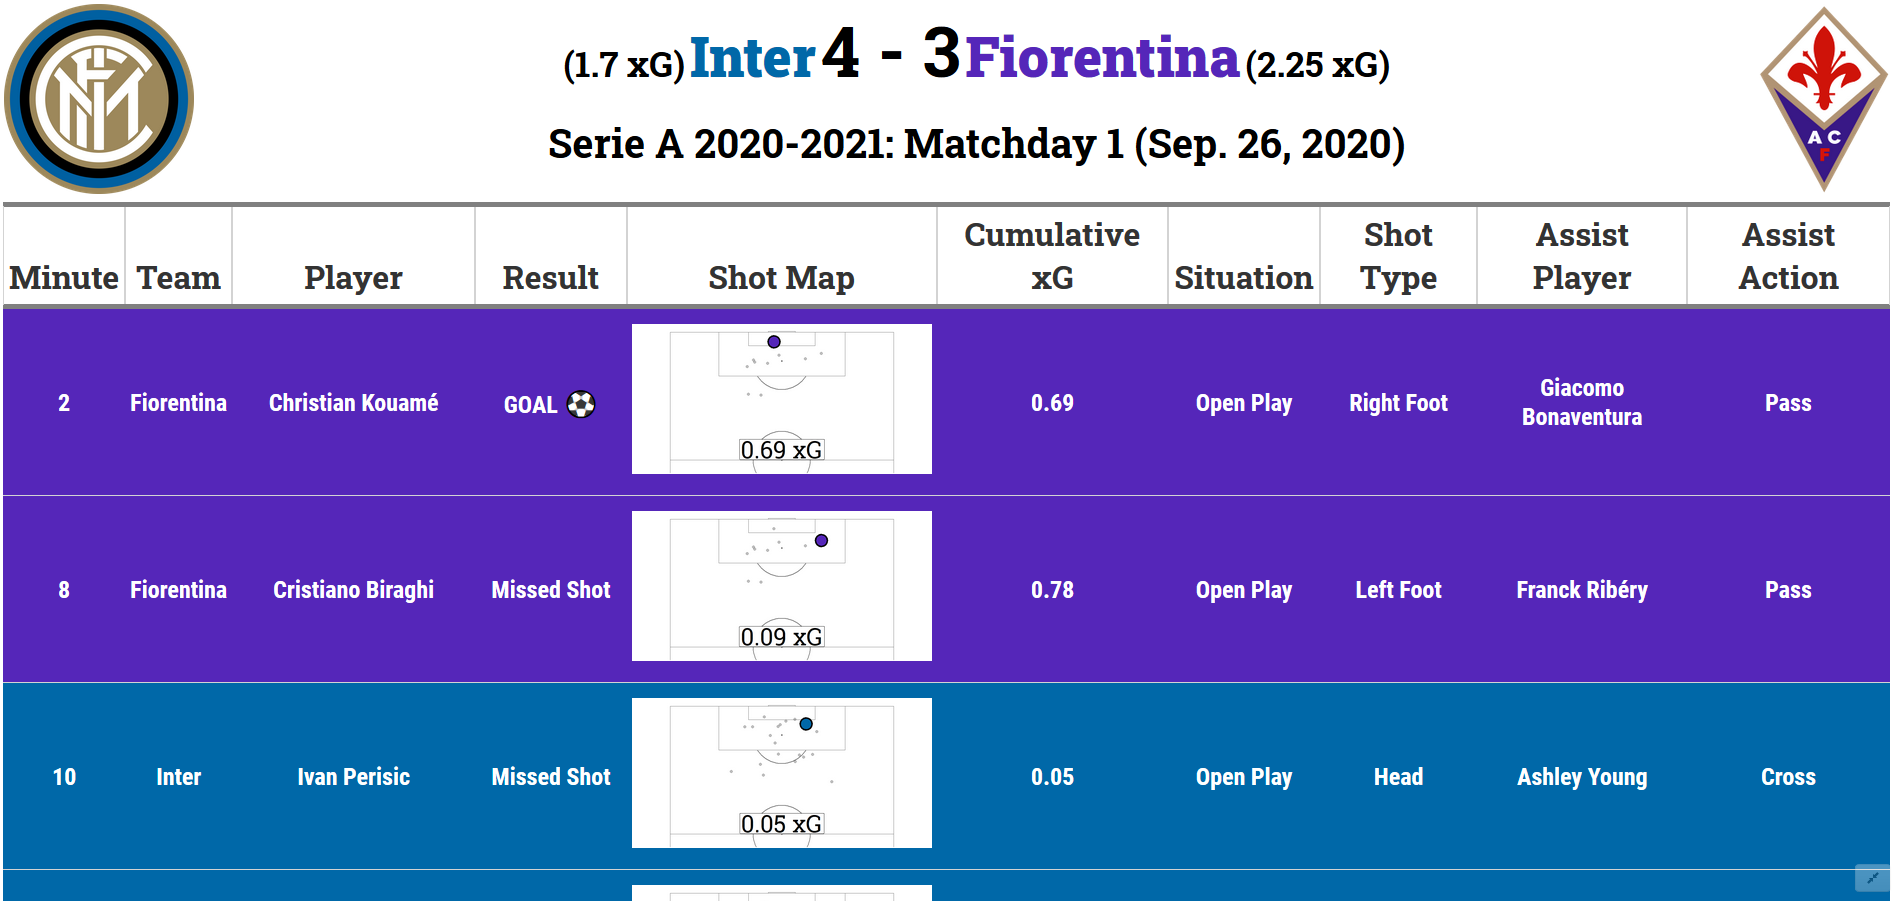
One of the new viz I created was a chronological table of shots during the course of the match which provides the viewer with a lot more detail about any individual shot. Besides the xG value, things like the “situation” (open play? free kick? etc.), “shot type” (right, left, header), etc. were added for more context. In general I wanted the next series of viz to add a bit more context to the overall xG flow graph and the shot maps.
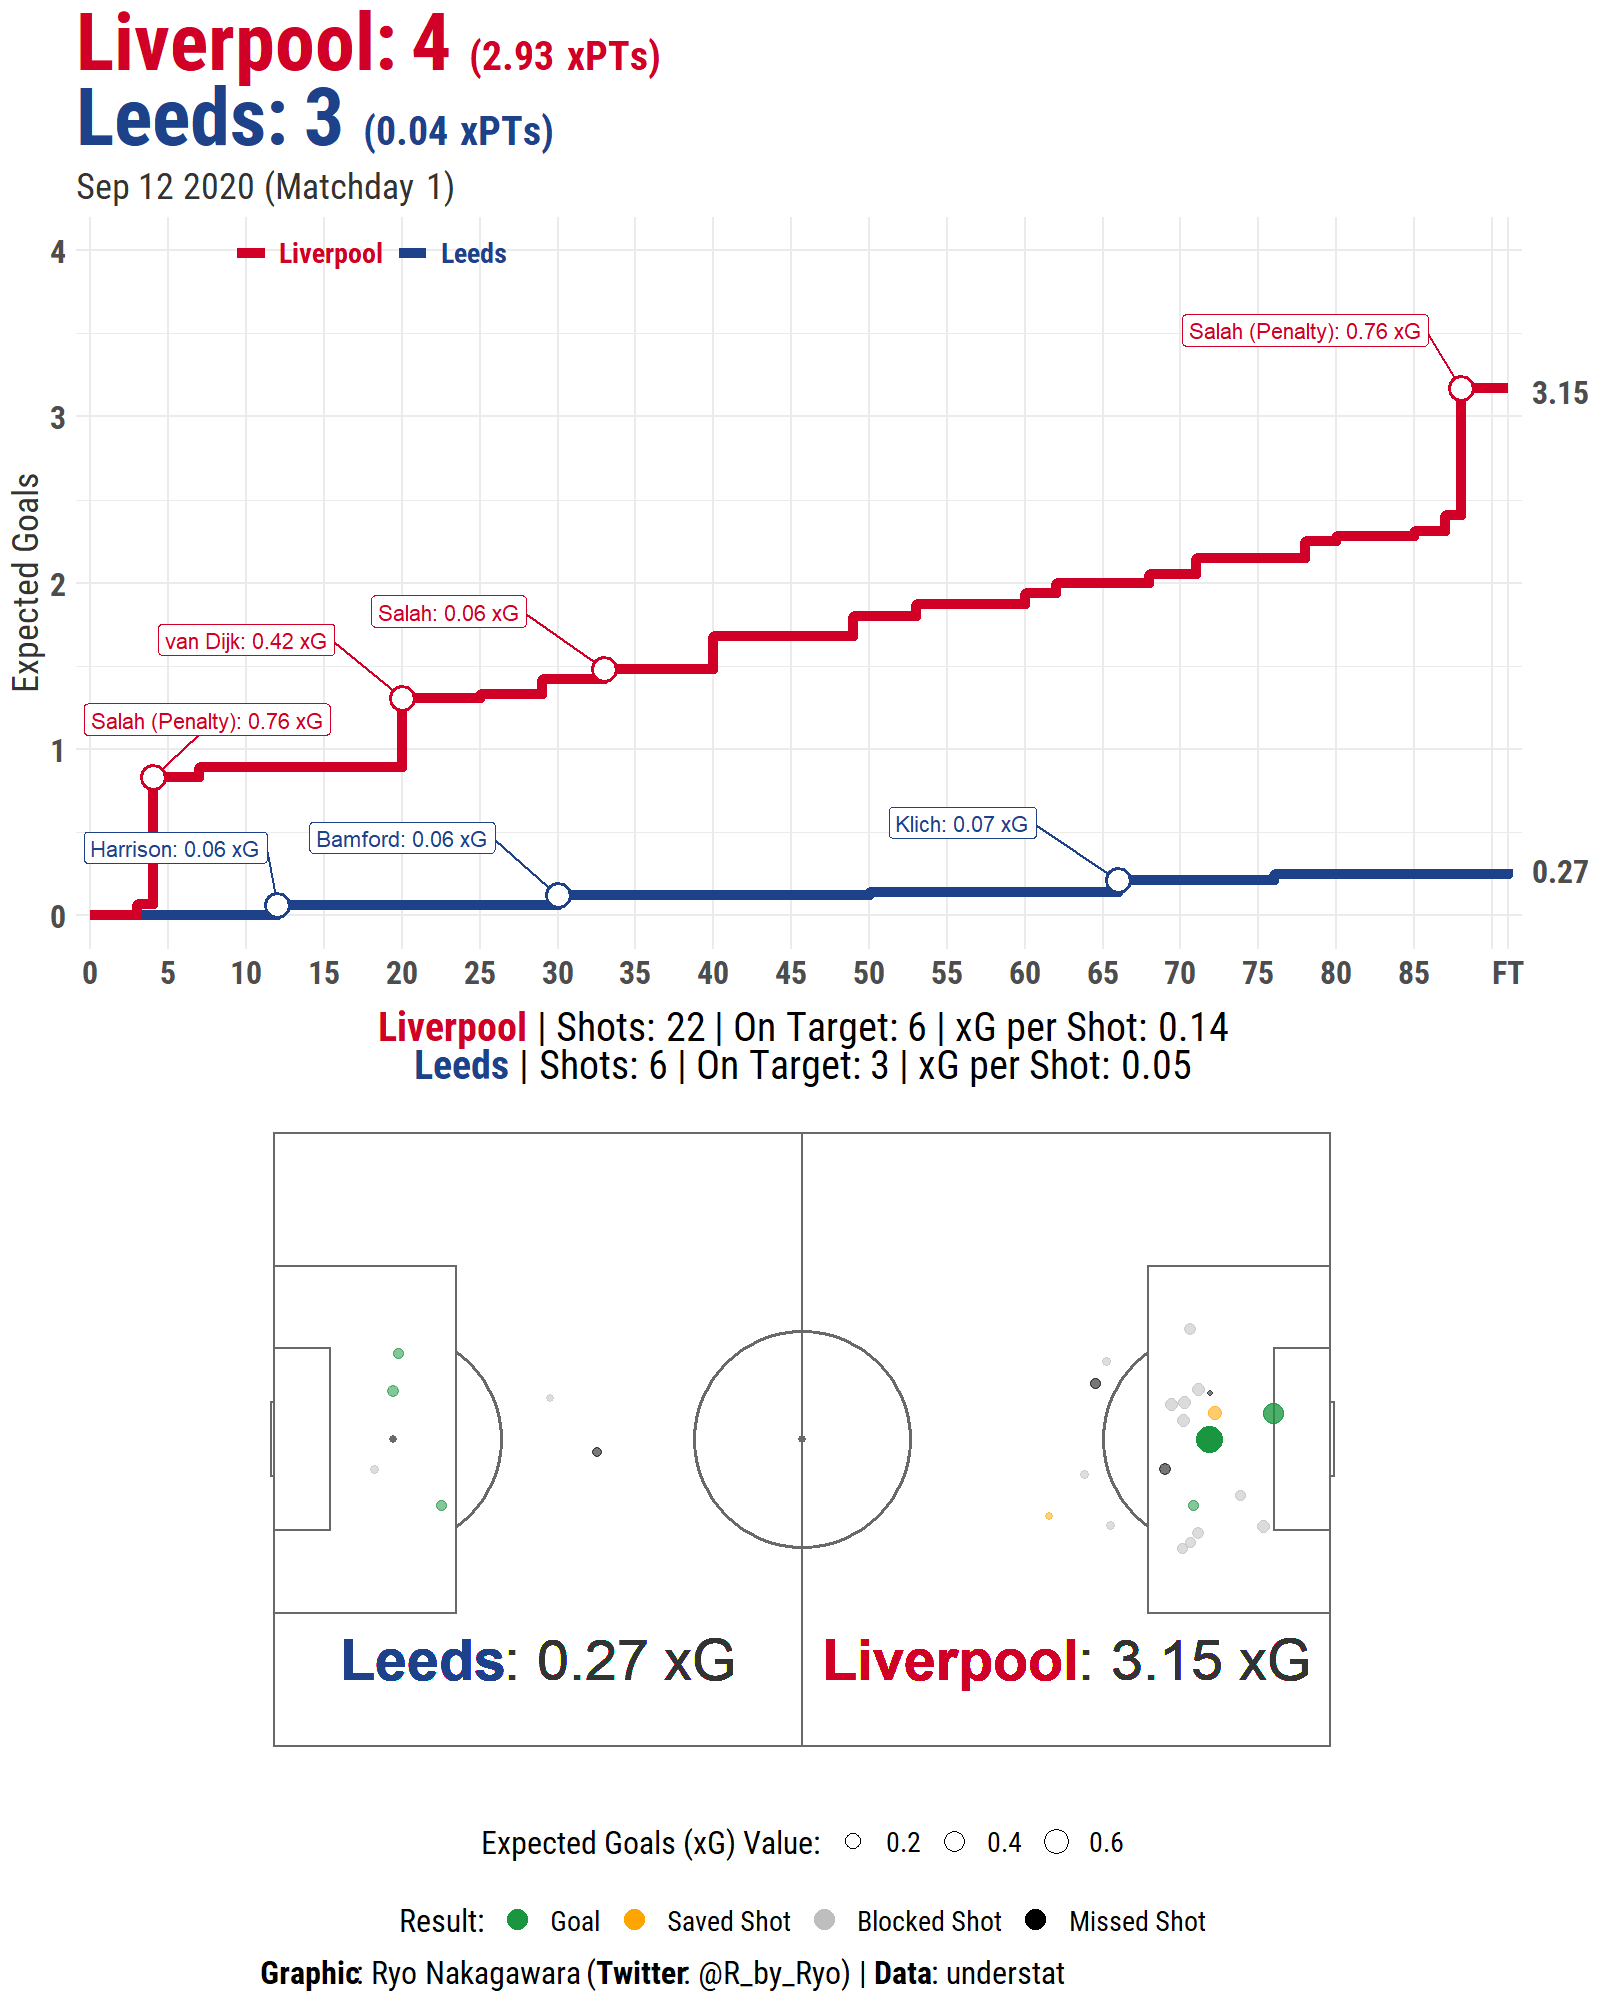
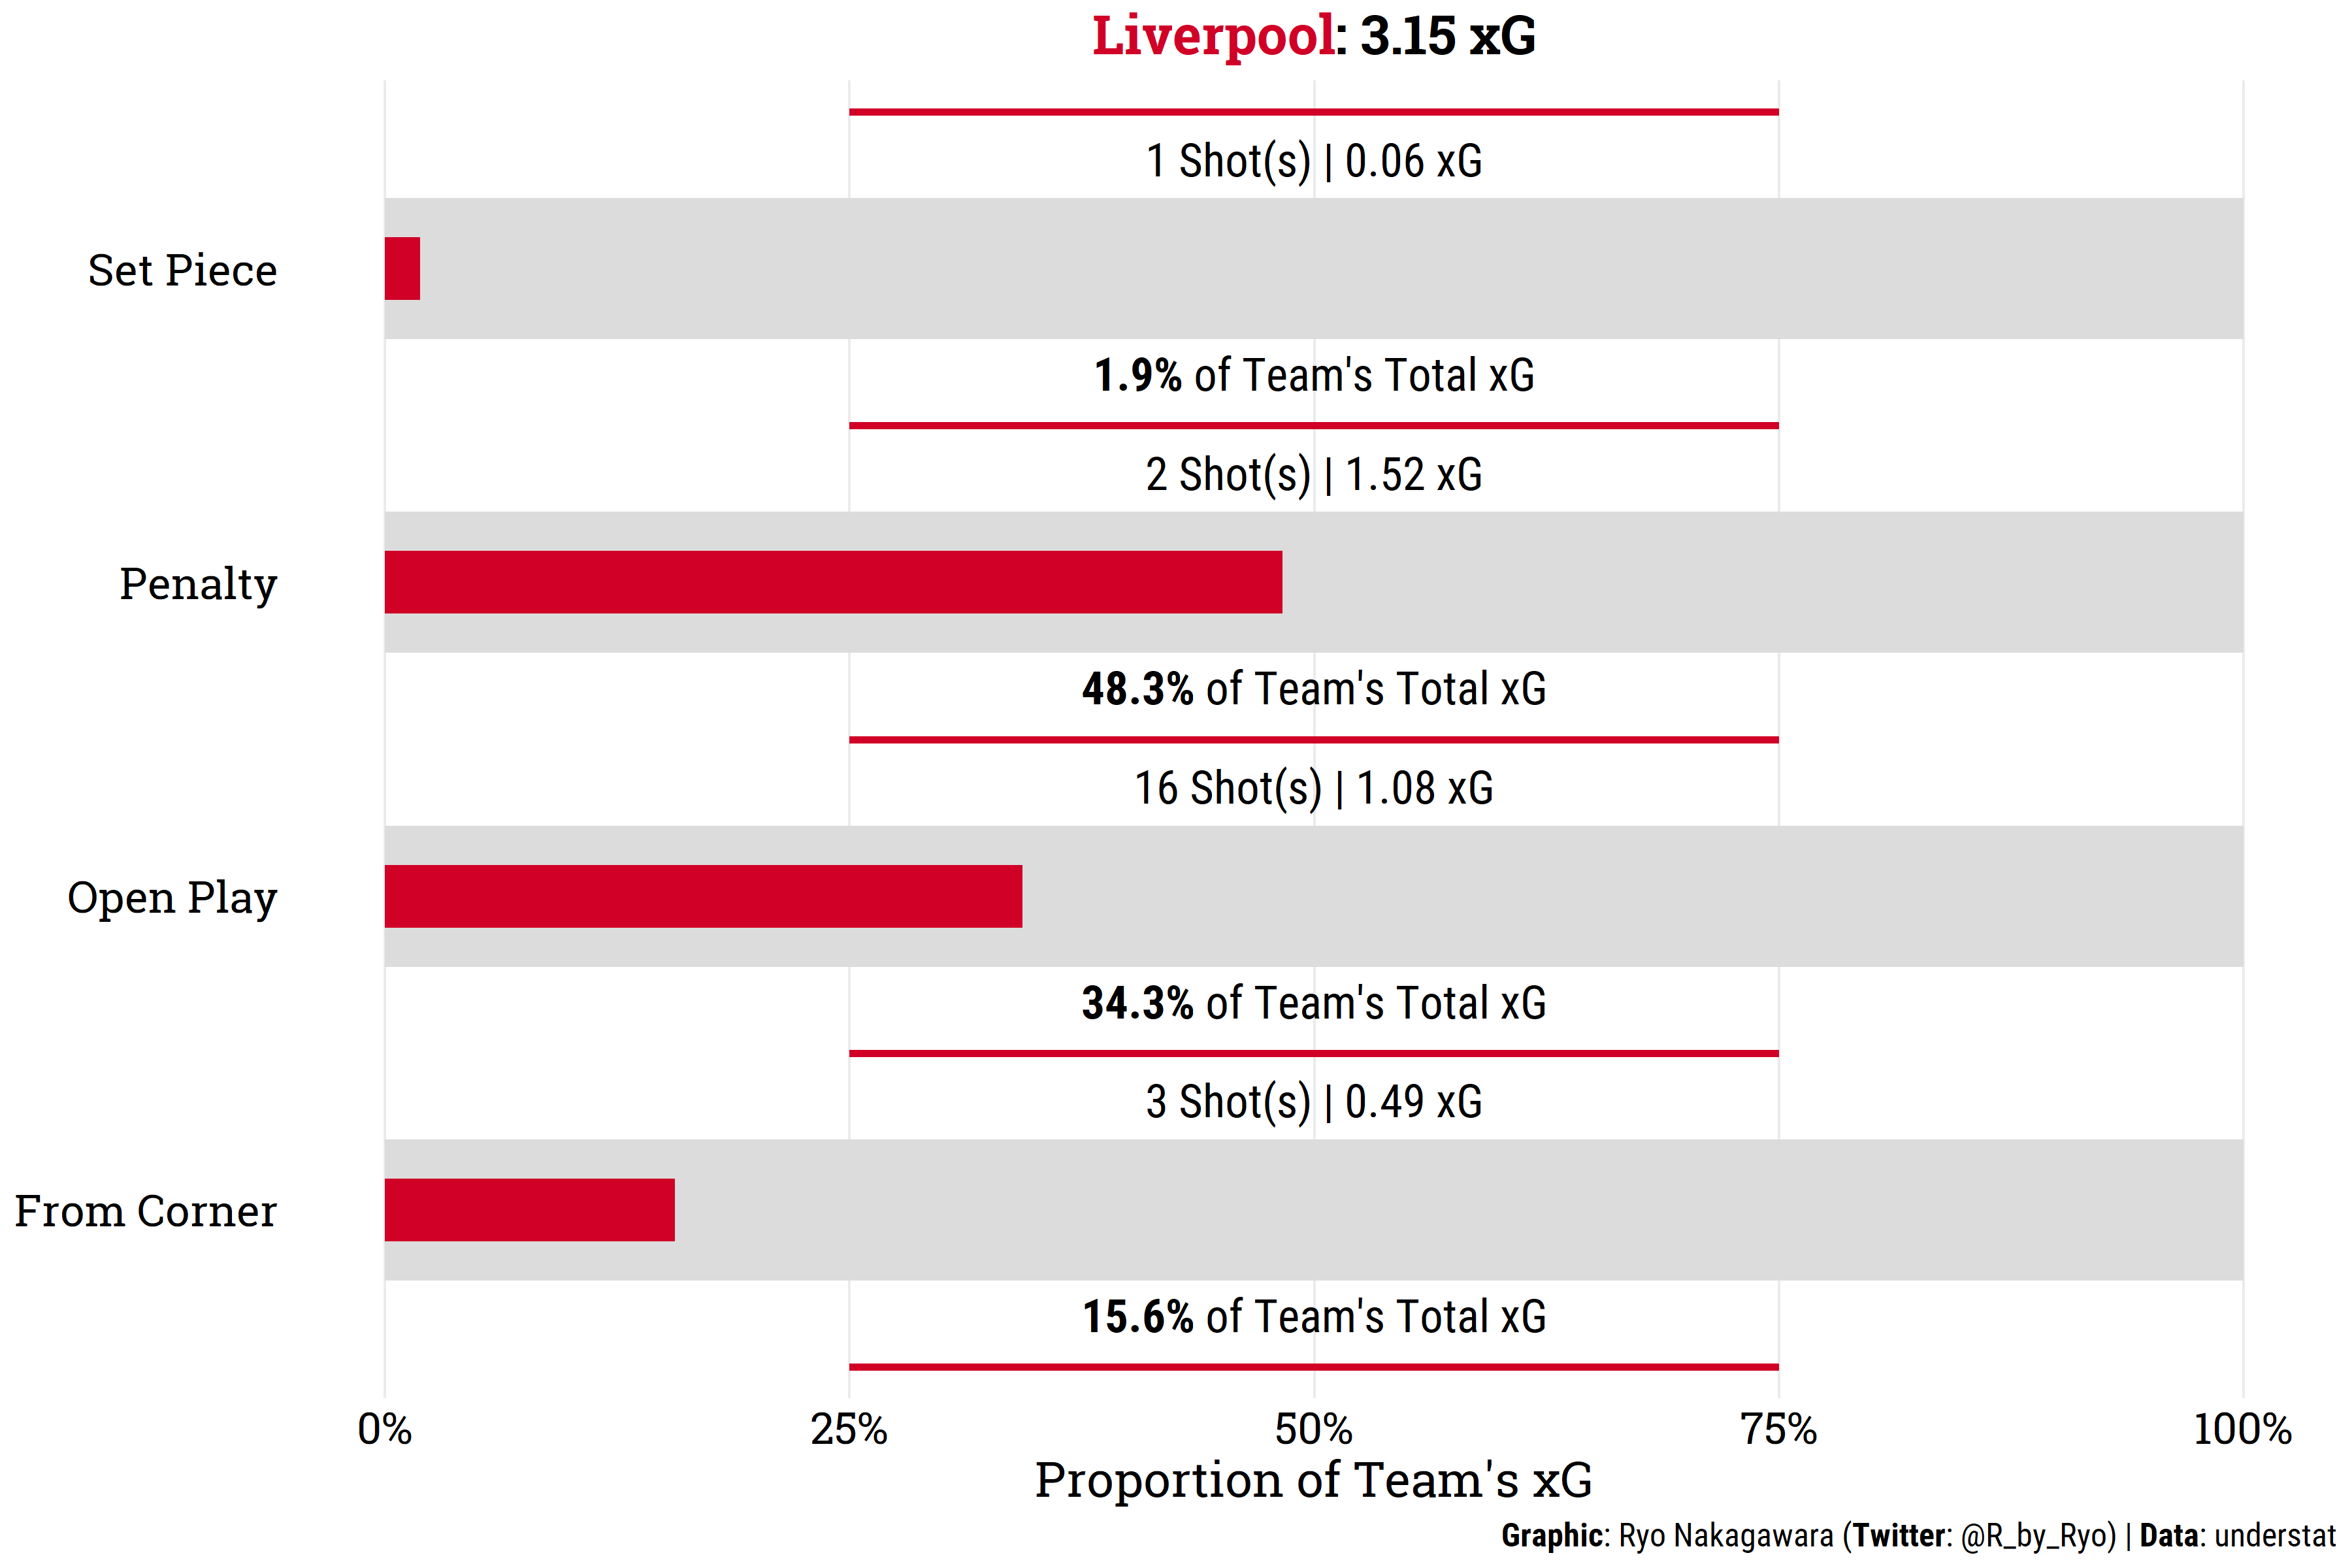
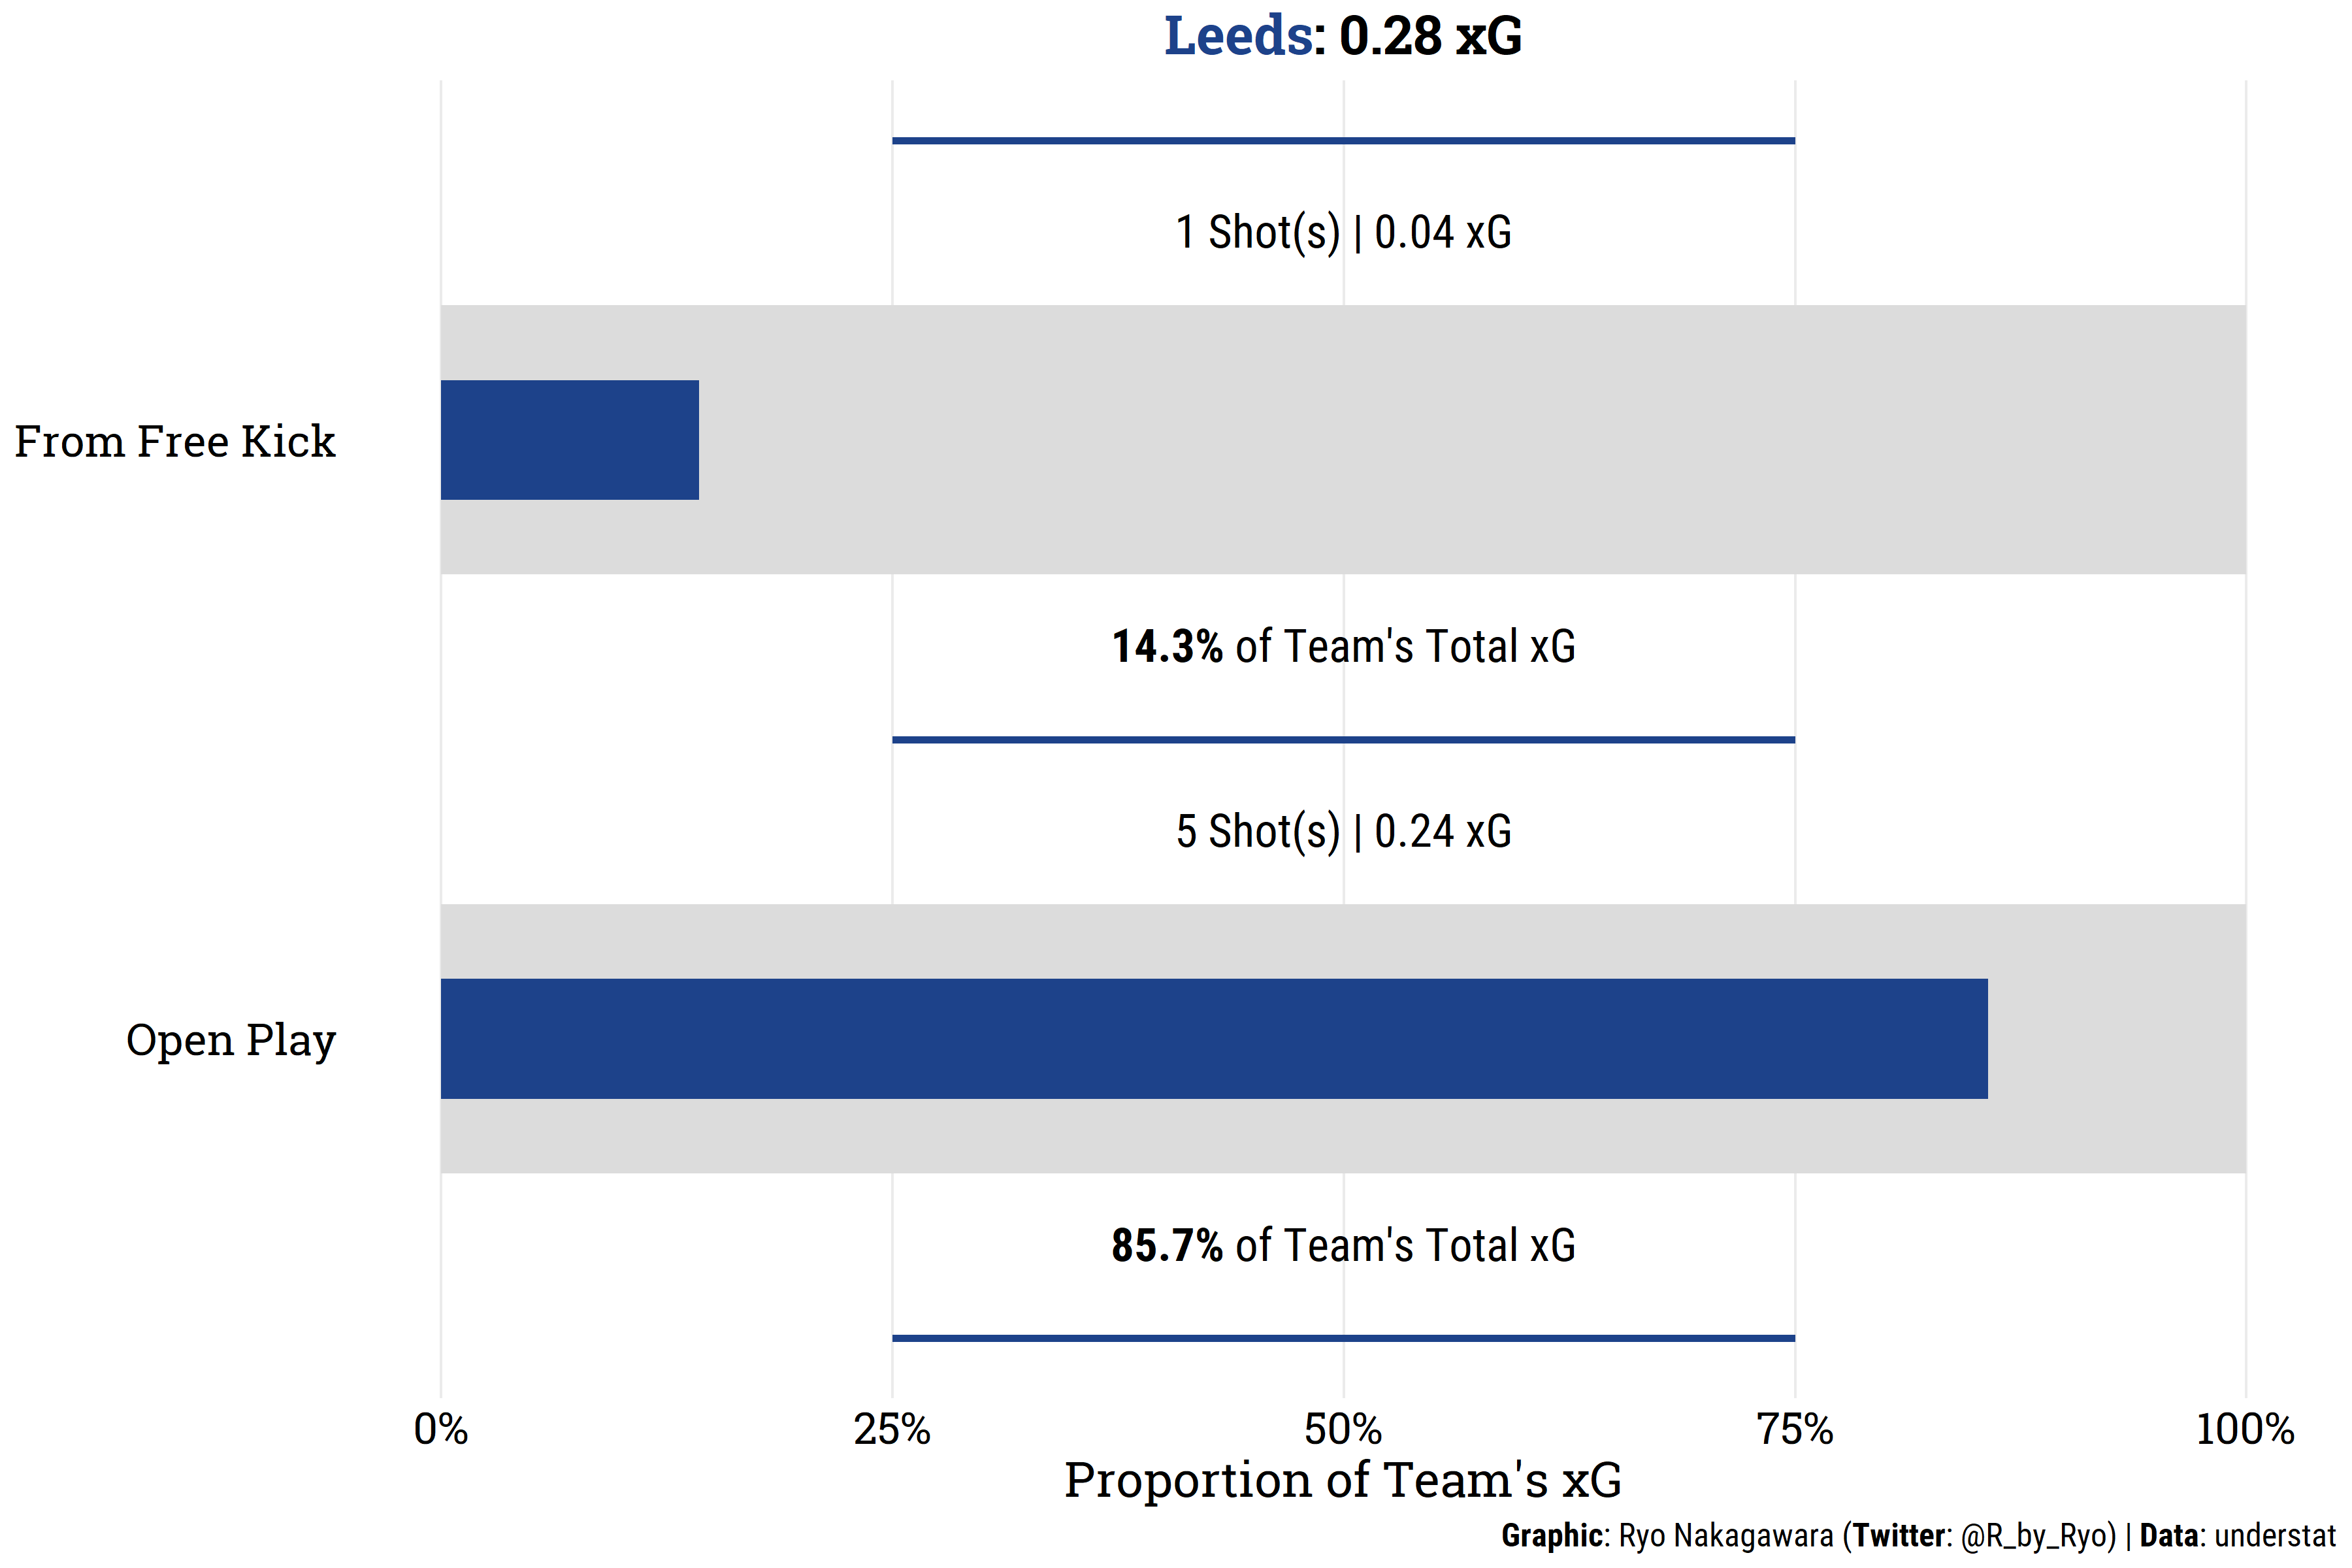
So here are the new xG match summary viz in their entirety (minus the timeline table which was the first image you saw on this blog post):
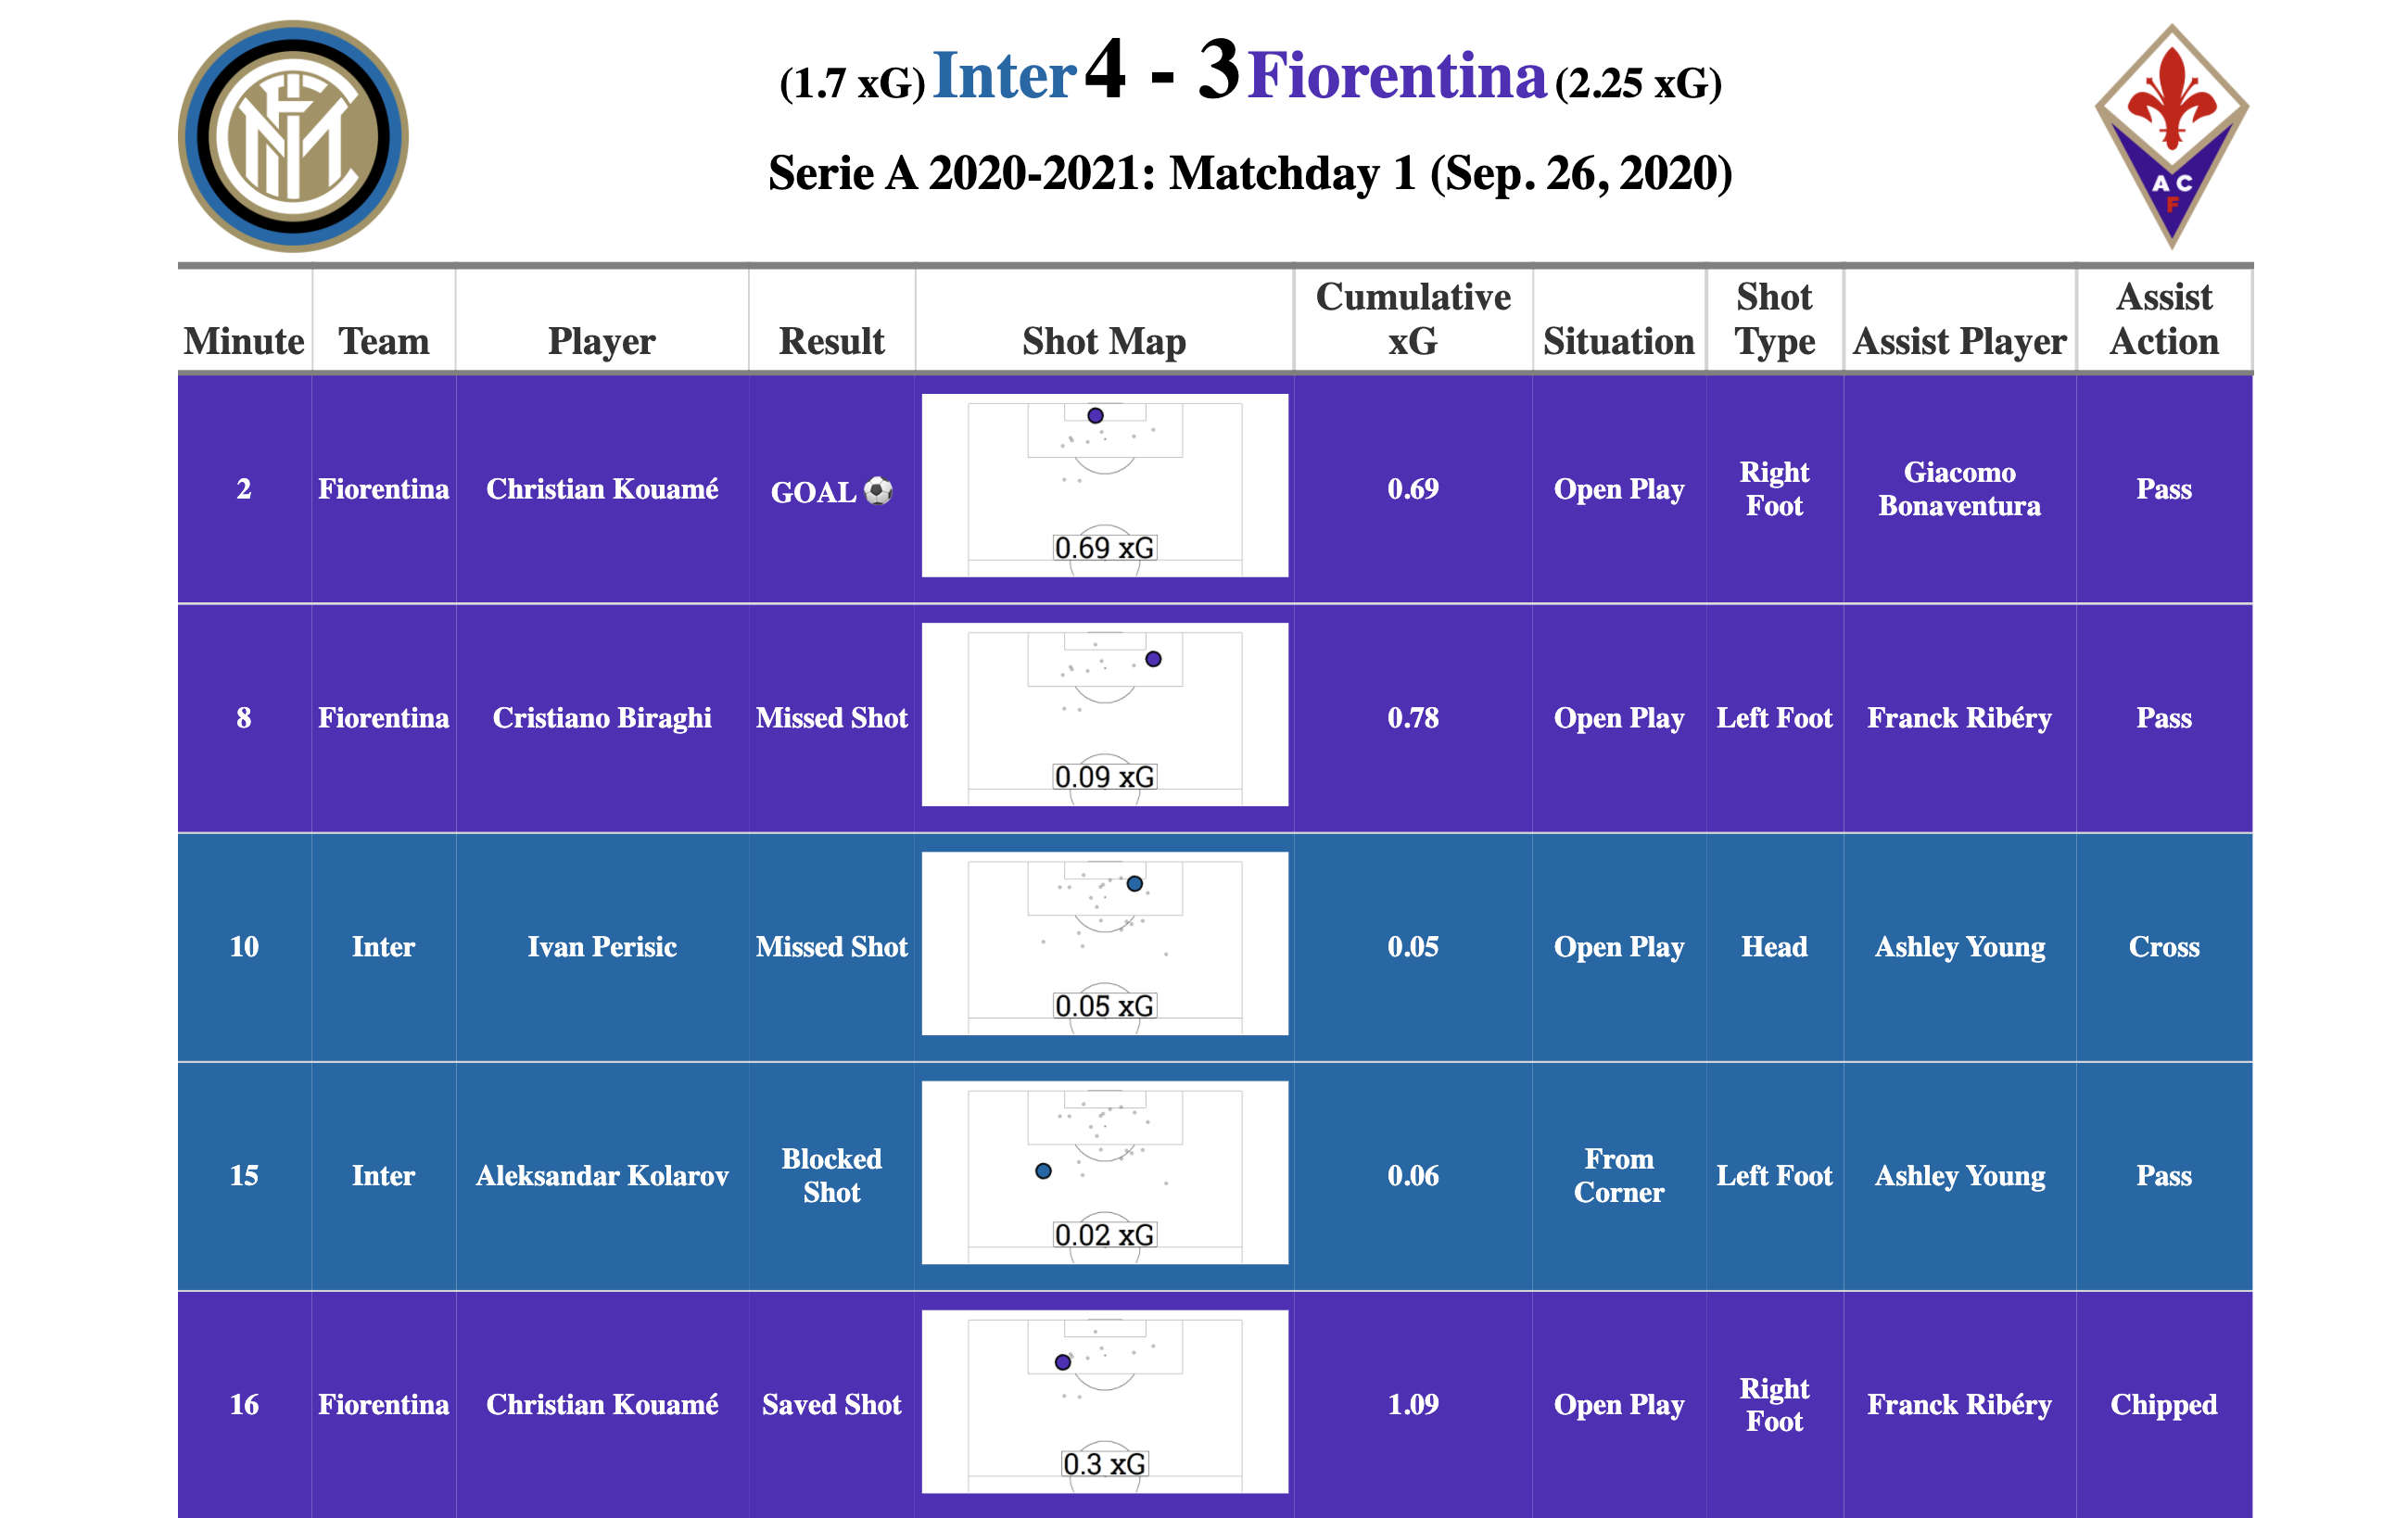
This blog post will only go over the {gt} time lines.
Find the full tutorial at
The Tutorial blog post contains:
- Motivation: An extension of some of the soccer viz I normally create and a desire to do something new.
- Data: understat.com
- Design Choices: Why I did what I did and some improvements that could still be made.
- Code Breakdown: Full 3-part code tutorial from getting the data, cleaning and reshaping the data, and finally creating the table visualization with the {gt} package.