mtcars %>%
  ggplot(aes(x = cyl, y = mpg)) %>%
  geom_point()
#> Error in mtcars %>% ggplot(aes(x = cyl, y = mpg)) %>% geom_point(): could not find function "%>%"
x <- gapminder %>%
  filter(continent == "Asia") %>%
  group_by(country)
#> Error in gapminder %>% filter(continent == "Asia") %>% group_by(country): could not find function "%>%"
gapminder %>%
  ggplot(aes(x = lifeExp, y = population)) +
  geom_point()
#> Error in gapminder %>% ggplot(aes(x = lifeExp, y = population)): could not find function "%>%"
# Come up with a good mistake

mtcars %>%
  group_by(mtcars$mpg) %>%
  count()
#> Error in mtcars %>% group_by(mtcars$mpg) %>% count(): could not find function "%>%"
library(reprex)
#> Warning: package 'reprex' was built under R version 3.5.3
library(gapminder)
library(tidyverse)
#> Warning: package 'ggplot2' was built under R version 3.5.3

gapminder %>%
ggplot(aes(x = lifeExp, y = population)) +
  geom_point()
#> Don't know how to automatically pick scale for object of type tbl_df/tbl/data.frame. Defaulting to continuous.
#> Error: Aesthetics must be either length 1 or the same as the data (1704): y
library(reprex)
#> Warning: package 'reprex' was built under R version 3.5.3
library(gapminder)
#> Warning: package 'gapminder' was built under R version 3.5.2
library(tidyverse)
#> Warning: package 'tidyverse' was built under R version 3.5.2
#> Error: package or namespace load failed for 'tidyverse' in loadNamespace(j <- i[[1L]], c(lib.loc, .libPaths()), versionCheck = vI[[j]]):
#>  there is no package called 'purrr'
gapminder %>%
  ggplot(aes(x = lifeExp, y = population)) +
  geom_point()
#> Error in gapminder %>% ggplot(aes(x = lifeExp, y = population)): could not find function "%>%"
library(tidyverse)
#> Warning: package 'ggplot2' was built under R version 3.5.3
#> Warning: package 'tibble' was built under R version 3.5.3
library(gapminder)
library(reprex)
#> Warning: package 'reprex' was built under R version 3.5.3

gapminder %>% ggplot(x = year, y = gdp) + geom_point()
#> Error: geom_point requires the following missing aesthetics: x, y
Hi there! Your x and y axis variables need to be inside an aes() call. These variables are setting the aesthetics for your plot, which is where that error message comes from. Try this:
you need to make sure the magrittr pipe is installed.
That usually means installing a package and then using a library call to make it available.
I usually install.packages(tidyverse)
then library(tidyverse)
install.packages('tidyverse')
library(tidyverse)
You could also use dplyr or the magrittr package itself.
You want to set wait equal to max(waiting).
This requires one equals sign.
When you use two equal signs, you are (effectively) asking a question - are these two things equal? - in a logical expression.
Try this instead
ggplot() function requires 2 arguments: data and mapping. You provided the gapminder data, but when you specified mapping, you forgot to wrap it around aes(). Following should work:
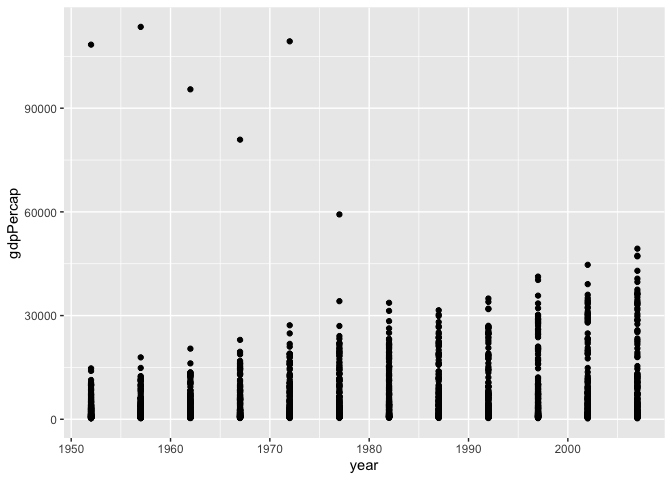
gapminder %>% ggplot(aes(x = year, y = gdp)) + geom_point()