Hi!
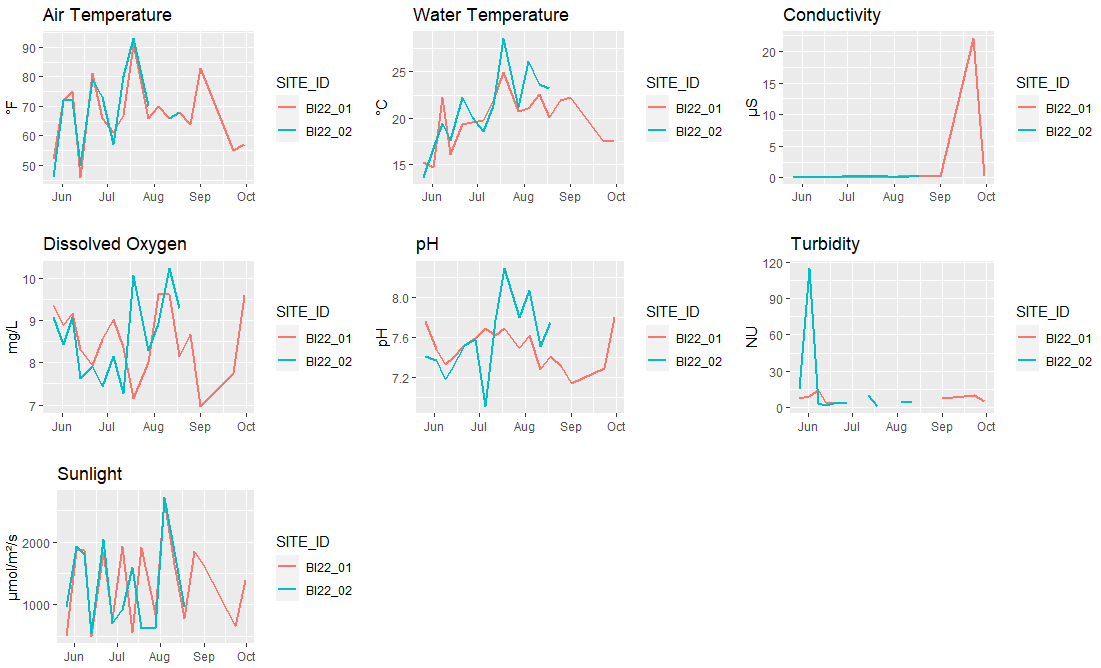
I want to pass a plot function over several columns in a data frame, including titles and y-labels unique to the data. I created a data frame of the associated labels and titles, as below:
structure(list(AIR_TEMP_F = c("°F", "Air Temperature"), TEMP_C = c("°C",
"Water Temperature"), COND_US = c("µS", "Conductivity"), DO_MG_L = c("mg/L",
"Dissolved Oxygen"), PH = c("pH", "pH"), TURB_NU = c("NU", "Turbidity"
), LIGHT_AMB = c("µmol/m²/s", "Sunlight")), row.names = c("ylab",
"title"), class = "data.frame")
Then I write a function to create a plot for each of the columns in my target data frame, and I'm trying to match the titles and labels in the above data frame to the plots created by the function:
wqplot <- function(parameter){
  ggplot(dmean) +
    geom_line(aes(x=DATE,
                  y={{parameter}},
                  color=SITE_ID), linewidth=1) +
    xlab("") +
    ylab(wqlabs[1,parameter]) +
    ggtitle(wqlabs[2,parameter])
}

grid.arrange(grobs=map(target.cols, wqplot))
And that doesn't work. Not only does it not plot my data properly, it doesn't have a y axis, only my labels and the column names, like this:
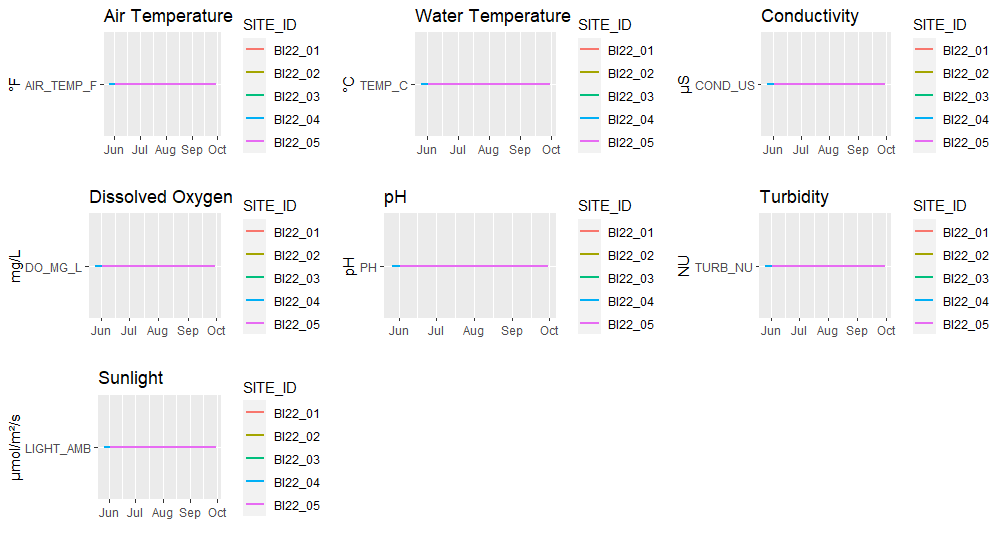
Any ideas?
Thanks so much for your help!
Here is a snippet of my data:
dmean <- structure(list(SITE_ID = c("BI22_01", "BI22_01", "BI22_01", "BI22_01",
"BI22_01", "BI22_01", "BI22_01", "BI22_01", "BI22_01", "BI22_01",
"BI22_01", "BI22_01", "BI22_01", "BI22_01", "BI22_01", "BI22_01",
"BI22_01", "BI22_02", "BI22_02", "BI22_02", "BI22_02", "BI22_02",
"BI22_02", "BI22_02", "BI22_02", "BI22_02", "BI22_02", "BI22_02",
"BI22_02", "BI22_02"), DATE = structure(c(19138, 19145, 19151,
19156, 19164, 19171, 19178, 19185, 19191, 19201, 19208, 19215,
19222, 19229, 19236, 19258, 19265, 19138, 19145, 19151, 19156,
19164, 19171, 19178, 19185, 19191, 19201, 19208, 19215, 19222
), class = "Date"), AIR_TEMP_F = c(52, 72, 75, 46, 81, 66, 61,
67, 91, 66, 70, 66, 68, 64, 83, 55, 57, 46, 72, 72, 50, 79, 73,
57, 80, 93, 70, NA, 66, 68), TEMP_C = c(15.2816666666667, 14.74375,
22.25375, 16.08625, 19.3875, 19.55625, 19.805, 21.8875, 24.94,
20.77, 21.08375, 22.60875, 20.05625, 21.89625, 22.249, 17.48625,
17.505, 13.665, 16.7375, 19.46375, 17.60375, 22.205, 20.10625,
18.535, 21.4325, 28.5875, 21.2025, 26.1025, 23.60625, 23.255),
    COND_US = c(0.1075, 0.11925, 0.2765, 0.135, 0.121375, 0.139,
    0.137125, 0.13725, 0.143, 0.13825, 0.14025, 0.15, 0.15375,
    0.17975, 0.165375, 22.028625, 0.154833333333333, 0.13025,
    0.13525, 0.1345, 0.13425, 0.136, 0.13975, 0.145, 0.142125,
    0.149625, 0.14375, 0.135, 0.15175, 0.1595), DO_MG_L = c(9.34833333333333,
    8.8825, 9.17625, 8.31875, 7.94625, 8.55, 9.0175, 8.36125,
    7.15375, 8.005, 9.6125, 9.62875, 8.15375, 8.6725, 6.95625,
    7.7425, 9.59833333333333, 9.07, 8.4375, 9.07875, 7.63375,
    7.9075, 7.43125, 8.15375, 7.275, 10.07875, 8.28125, 8.9325,
    10.24375, 9.28), PH = c(7.76, 7.48125, 7.33, 7.3825, 7.51875,
    7.5855, 7.685, 7.6175, 7.685, 7.49, 7.61625, 7.27875, 7.41125,
    7.30375, 7.13625, 7.28875, 7.795, 7.41, 7.36875, 7.18125,
    7.28875, 7.5225, 7.5825, 6.90125, 7.77125, 8.295, 7.8025,
    8.07, 7.50875, 7.75), TURB_NU = c(7.4, 9.5625, 14.075, 3.15,
    3.0625, NA, NA, 1.6875, NA, NA, 3.2375, NA, NA, NA, 7.475,
    9.7375, 5.28333333333333, 15.175, 114.925, 3.5625, 1.45,
    4.175, 3.1875, NA, 9.8375, 0.6875, NA, 3.95, 5.35, NA), LIGHT_AMB = c(500.716666666667,
    1863.75, 1864.625, 494.05, 1834.375, 773.175, 1938.125, 556.125,
    1919, 838.2875, 2666.3, 1641.5625, 781.3575, 1850.8, 1612.3125,
    651.1125, 1381.88333333333, 959.6, 1936.125, 1802, 548.8,
    2043.25, 705.1625, 931.6375, 1593.9625, 616.725, 627.69625,
    2707.6125, 1850, 962.09), LIGHT_UW = c(26.3216666666667,
    63.475, 286.36, 61.07375, 416.23125, 120.5575, 434.875, 94.1375,
    326.5125, 470.3375, 609.15375, 1437.458375, 625.74, 787.4975,
    973.7075, 263.129125, 1128.42666666667, 136.45, 241.275,
    335.42625, 88.3925, 628.625, 173.8325, 197.73875, 351.42875,
    128.525, 311.12875, 559.31625, 919.87875, 727.6525), Month = c(5,
    6, 6, 6, 6, 6, 7, 7, 7, 7, 8, 8, 8, 8, 9, 9, 9, 5, 6, 6,
    6, 6, 6, 7, 7, 7, 7, 8, 8, 8)), class = c("grouped_df", "tbl_df",
"tbl", "data.frame"), row.names = c(NA, -30L), groups = structure(list(
    SITE_ID = c("BI22_01", "BI22_02"), .rows = structure(list(
        1:17, 18:30), ptype = integer(0), class = c("vctrs_list_of",
    "vctrs_vctr", "list"))), class = c("tbl_df", "tbl", "data.frame"
), row.names = c(NA, -2L), .drop = TRUE))