Hi!
I am currently struggling with my output of a plot. I want to display the distribution of gender in different groups. I have succeeded in plotting this.
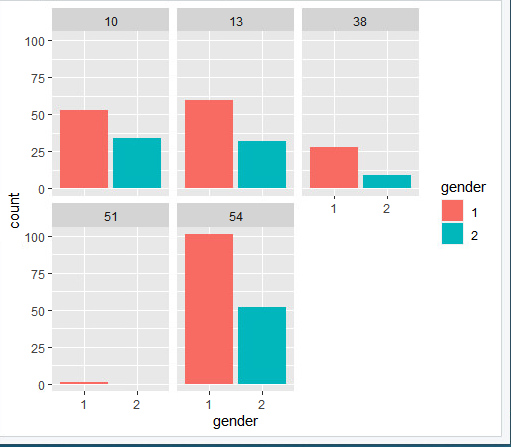
I don't seem to succeed in adding the right labels to the plot... For instance: I want to label the red and blue charts as man/woman (where they're now labeled as 1 or 2).I have already labeled these in my script. I also want to label each group (now labeled as 10, 38, 51, etc.) at the top of each chart. Does anyone know how I could fix this? Thanks in advance!
My script so far:
Dataframe$gender <- factor(Dataframe$gender)
levels=c(1,2,3)
labels=c("man", "woman", "else")
#barplot
ggplot(Dataframe, aes(x = gender, fill = gender)) +
geom_bar() + facet_wrap(~zkh)
The plot: