Hi All,
I've asked a couple of formatting questions recently. Apologies.
However, I wondered if someone could help with adjusting the title size of some output created as.grob using ggplotify please?
In particular, when I use the 'cex' parameter to control cex.main, cex.lab, or even just cex, it only seems to to affect the size of the text in the heatmap key and not the main title size.
Would appreciate if someone could help with controlling the title size in this context please.
library(kohonen)
library(ggplotify)
library(ggplot2)
X0 <- c(1,2,3,3,3,3,3,3,3,2,2,2,2,2,2,2,2,2,2,1,1,1,1)
X1 <- c(3,3,1,1,3,3,3,3,3,2,2,2,2,2,2,2,2,2,2,1,1,1,1)
X2 <- c(1,2,1,1,1,1,1,1,3,2,2,3,2,2,2,2,2,2,2,1,1,1,1)
X3 <- c(1,2,3,2,2,2,2,2,3,2,2,1,3,2,2,2,2,2,2,1,1,3,1)
X4 <- c(1,2,3,3,3,3,3,3,3,2,2,2,2,2,2,2,1,1,1,1,1,2,3)
dat <- data.frame(X0, X1, X2, X3, X4)
dat <- as.matrix(dat)
init <- somInit(dat, 4, 4)
som <- kohonen::som(dat, grid = kohonen::somgrid(4, 4, "hexagonal"), rlen = 100, alpha = c(0.05, 0.01),
dist.fcts = "euclidean", init = init, keep.data = TRUE)
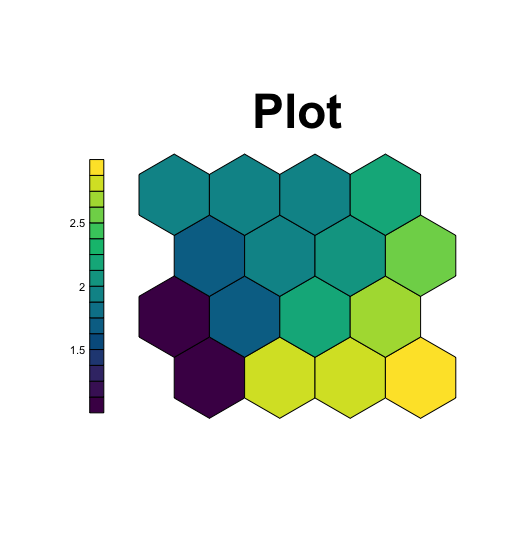
plot <- ggplotify::as.grob(~plot(som, type = "property", property = getCodes(som, 1)[,1],
shape = "straight", palette.name = hcl.colors, main = "Plot", cex = 0.7))
grid.arrange(plot, nrow = 1)