Hi,
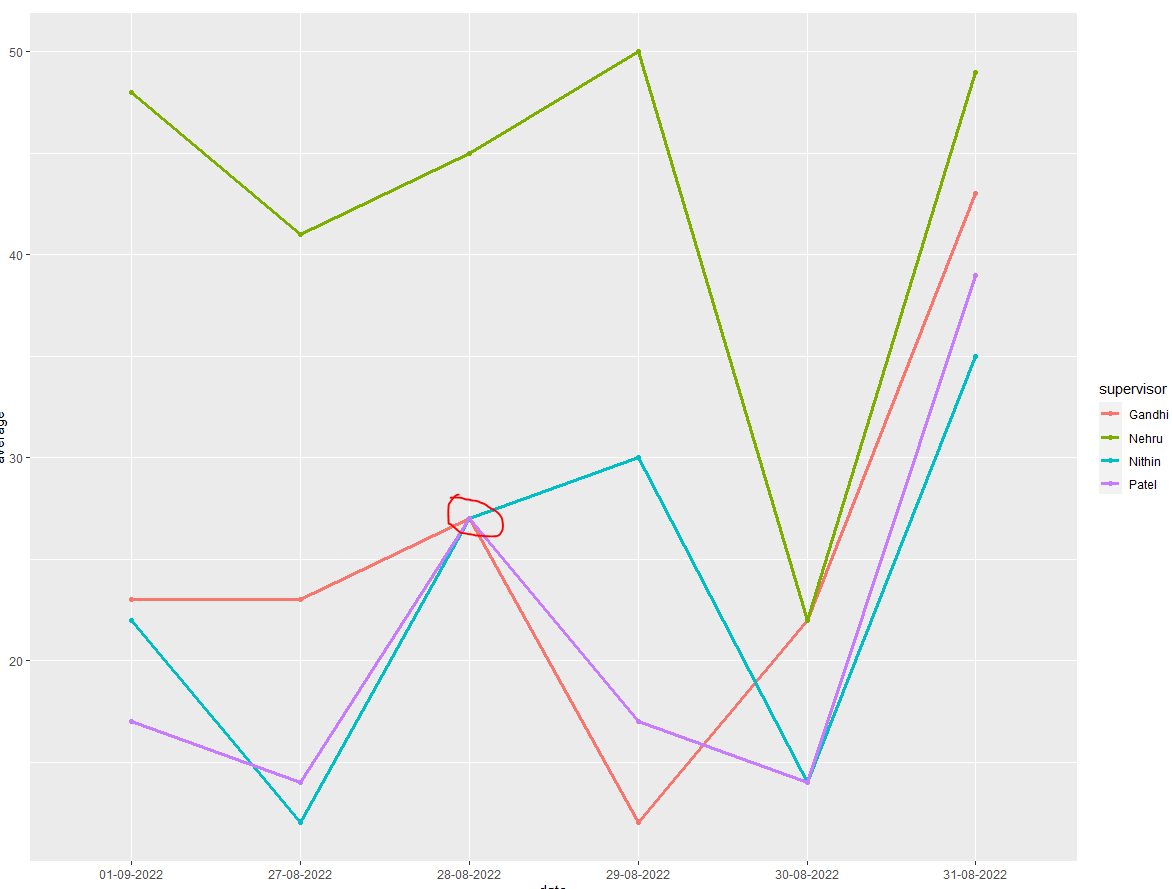
I am having scores of students who I need to track over a few days. I have to make a line graph for this. But the graph I make have overlapping lines and it makes a bit difficult for visual interpretation. How can I adjust the positioning of the lines and make it better looking?
library(tidyverse)
library(janitor)
#>
#> Attaching package: 'janitor'
#> The following objects are masked from 'package:stats':
#>
#>     chisq.test, fisher.test
data<-tibble::tribble(
         ~date, ~supervisor, ~average,
  "27-08-2022",    "Nithin",      12L,
  "28-08-2022",    "Nithin",      27L,
  "29-08-2022",    "Nithin",      30L,
  "30-08-2022",    "Nithin",      14L,
  "31-08-2022",    "Nithin",      35L,
  "01-09-2022",    "Nithin",      22L,
  "27-08-2022",    "Gandhi",      23L,
  "28-08-2022",    "Gandhi",      27L,
  "29-08-2022",    "Gandhi",      12L,
  "30-08-2022",    "Gandhi",      22L,
  "31-08-2022",    "Gandhi",      43L,
  "01-09-2022",    "Gandhi",      23L,
  "27-08-2022",     "Nehru",      41L,
  "28-08-2022",     "Nehru",      45L,
  "29-08-2022",     "Nehru",      50L,
  "30-08-2022",     "Nehru",      22L,
  "31-08-2022",     "Nehru",      49L,
  "01-09-2022",     "Nehru",      48L,
  "27-08-2022",     "Patel",      14L,
  "28-08-2022",     "Patel",      27L,
  "29-08-2022",     "Patel",      17L,
  "30-08-2022",     "Patel",      14L,
  "31-08-2022",     "Patel",      39L,
  "01-09-2022",     "Patel",      17L
  )


data %>%
  ggplot(aes(date,average,group=supervisor,color=supervisor))+
  geom_line(size=1.2)+
  geom_point(size=1.5)


Created on 2022-09-09 by the reprex package (v2.0.1)