Greetings to all!
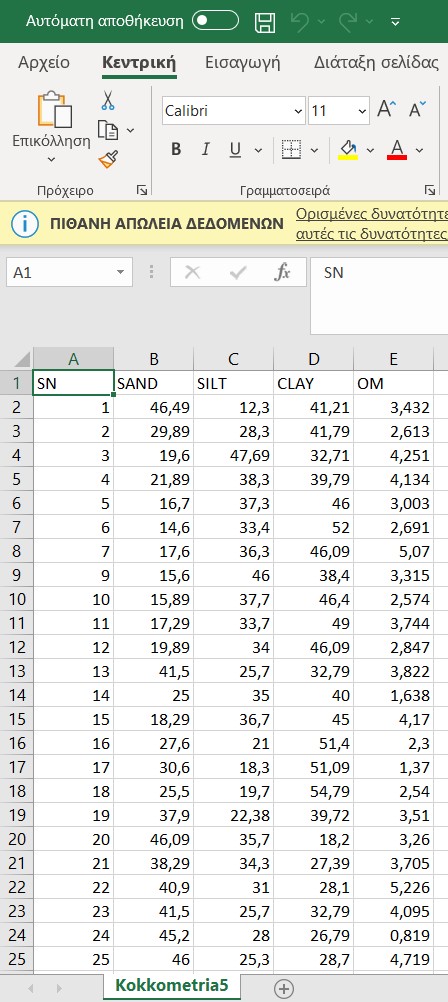
I'm a new user in R, whilst i use itin my studies in digital soil mapping. I have my data as you can see you in my .csv file, there are columns SN(sample number), SAND, SILT, CLAY, OM(Organic Matter). I am trying to create a variogram for each property. Specifically, one variogram for clay, one for silt, one for sand, and one for organic matter.
Any ideas of how i can accomplish this?
Ps* I have tried to write some code in R, but with the screesnshots you can see, i managed to create the following variograms that i dont belive are so good,and i failed to make kriging.
As you can see, the code i wrote in rstudio is:
setwd("D:/R/WorkDir")
getwd()
First i set and validate "where" my working directory is.
install.packages(c("viridis","ggplot2","sf","gridExtra","stars","gstat","rgdal","sp"))
library(viridis)
library(sp)
library(sf)
library(ggplot2)
library(gridExtra)
library(stars)
library(gstat)
library(rgdal)
Then i install the packages i will use, and then place them in the library.
Augers = readOGR("Augers.shp")
With the use of the command/function readOGR, i insert in R, the shapefile with my data from ArcGIS.
pH = Augers@data$pH
qqnorm(Augers$pH)
summary(Augers)
Use of qqnorm in order to create a normal-quantile plot for my data
Use of qqline in order to create a quantile-quantile line for my variable
Use of shapiro.test in order to conduct a normality test for my variable
shapiro.test(Augers$pH)
Next step is to create a variogram
In order to create a variogram i should have installed the package "gstat" and load it in the library
that i have already done!
#In the function of variogram the variable i chose and the data file are contained in the parenthesis.
pr.v <- variogram(Augers$pH ~ 1, Augers)
Then, after creating the variogram we should fit it in a model e.g. Exponential.
pr.vf.exp <- fit.variogram(pr.v, vgm(0.013,"Exp", 0.35, 0))
So, now, we 're going to plot the variogram using the function plot
plot(pr.v, pr.vf.exp)
If we want, we can chge the point characters in the variogram with the function pch , and the color to (e.g) red
in the variogram equation.
plot(pr.v, pr.vf.exp, pch =20, col ="red")
I will make the same procedure for the variable "sand" from my data file.
Sand = Augers@data$Sand
shapiro.test(Augers$Sand)
pr.v.sand <- variogram(Augers$Sand ~ 1, Augers)
pr.vfsand.exp <- fit.variogram(pr.v, vgm(0.013, "Exp", 0.35, 0))
plot(pr.v.sand, pr.vfsand.exp, pch =20, col ="red")
Variable Silt
Silt = Augers@data$Silt
shapiro.test(Augers$Silt)
pr.v.silt <- variogram(Augers$Silt ~ 1, Augers)
pr.vfsilt.exp <- fit.variogram(pr.v.silt, vgm(0.013, "Exp", 0.35, 0))
plot(pr.v.silt, pr.vfsilt.exp, pch =20, col ="red")
Variable clay
Clay = Augers@data$Clay
shapiro.test(Augers$Clay)
pr.v.clay <- variogram(Augers$Clay ~ 1, Augers)
pr.vfclay.exp <- fit.variogram(pr.v.clay, vgm(0.013, "Exp", 0.35, 0))
plot(pr.v.clay, pr.vfclay.exp, pch =20, col ="red")
Variable Organic Matter (OM)
OM = Augers@data$Οrganic_M
shapiro.test(Augers$Οrganic_M)
pr.v.OM <- variogram(Augers$Οrganic_M ~ 1, Augers)
pr.vfOM.exp <- fit.variogram(pr.v.OM, vgm(0.013, "Exp", 0.35, 0))
plot(pr.v.OM, pr.vfOM.exp, pch =20, col ="red")
Now, we should draw locations at which Kriging Predictions will be created
I will insert to read the shapefile titled "SMUs", in which we have the
shape and the length of the area where the augers are.
SMUs = readOGR("SMUs.shp")
spsample is spatial sample
SMUs.reg <- spsample(SMUs, 247, type = "regular")
Convert the object as a spatial Pixel Class
SMUs.grid <- SpatialPixels(SMUs.reg)
Conduct Kriging with the Exponential Model (using the function krige)
ok.exp <- krige(Augers$Sand ~ 1, Augers, SMUs.grid, pr.vfsand.exp)
warnings()
color.pal <- colorRampPalette(c("dark red", "orange","light yellow"))
color.palr <- colorRampPalette(c("light yellow","orange","dark red"))
spplot(ok.exp["var1.pred"], col.regions=color.pal) # Map Kriging predictions
spplot(ok.exp["var1.var"], col.regions=color.palr) # Map Kriging variances
From this, i created variograms that i dont believe that are much accurate.
Furthermore, i did not managed to succed Kriging, as i had the following errors:
SMUs.reg <- spsample(SMUs, 247, type = "regular")
Warning message:
In proj4string(obj) :
CRS object has comment, which is lost in output; in tests, see
Testing packages using CRS objectsConvert the object as a spatial Pixel Class
SMUs.grid <- SpatialPixels(SMUs.reg)
Conduct Kriging with the Exponential Model (using the function krige)
ok.exp <- krige(Augers$Sand ~ 1, Augers, SMUs.grid, pr.vfsand.exp)
[using ordinary kriging]
There were 50 or more warnings (use warnings() to see the first 50)
warnings()
Warning messages:
1: In predict.gstat(g, newdata = newdata, block = block, ... :
Covariance matrix singular at location [380909,4.17214e+06,0]: skipping...
2: In predict.gstat(g, newdata = newdata, block = block, ... :
Covariance matrix singular at location [379759,4.17329e+06,0]: skipping...
3: In predict.gstat(g, newdata = newdata, block = block, ... :
Covariance matrix singular at location [380909,4.17329e+06,0]: skipping...
4: In predict.gstat(g, newdata = newdata, block = block, ... :
Covariance matrix singular at location [382059,4.17329e+06,0]: skipping...
5: In predict.gstat(g, newdata = newdata, block = block, ... :
Covariance matrix singular at location [378609,4.17444e+06,0]: skipping...
6: In predict.gstat(g, newdata = newdata, block = block, ... :
Covariance matrix singular at location [379759,4.17444e+06,0]: skipping...
7: In predict.gstat(g, newdata = newdata, block = block, ... :
Covariance matrix singular at location [380909,4.17444e+06,0]: skipping...
8: In predict.gstat(g, newdata = newdata, block = block, ... :
Covariance matrix singular at location [382059,4.17444e+06,0]: skipping...
9: In predict.gstat(g, newdata = newdata, block = block, ... :
Covariance matrix singular at location [383209,4.17444e+06,0]: skipping...
10: In predict.gstat(g, newdata = newdata, block = block, ... :
Covariance matrix singular at location [378609,4.17559e+06,0]: skipping...
11: In predict.gstat(g, newdata = newdata, block = block, ... :
Covariance matrix singular at location [379759,4.17559e+06,0]: skipping...
12: In predict.gstat(g, newdata = newdata, block = block, ... :
Covariance matrix singular at location [380909,4.17559e+06,0]: skipping...
13: In predict.gstat(g, newdata = newdata, block = block, ... :
Covariance matrix singular at location [382059,4.17559e+06,0]: skipping...
14: In predict.gstat(g, newdata = newdata, block = block, ... :
Covariance matrix singular at location [378609,4.17674e+06,0]: skipping...
15: In predict.gstat(g, newdata = newdata, block = block, ... :
Covariance matrix singular at location [379759,4.17674e+06,0]: skipping...
16: In predict.gstat(g, newdata = newdata, block = block, ... :
Covariance matrix singular at location [380909,4.17674e+06,0]: skipping...
17: In predict.gstat(g, newdata = newdata, block = block, ... :
Covariance matrix singular at location [375159,4.17789e+06,0]: skipping...
18: In predict.gstat(g, newdata = newdata, block = block, ... :
Covariance matrix singular at location [376309,4.17789e+06,0]: skipping...
19: In predict.gstat(g, newdata = newdata, block = block, ... :
Covariance matrix singular at location [377459,4.17789e+06,0]: skipping...
20: In predict.gstat(g, newdata = newdata, block = block, ... :
Covariance matrix singular at location [378609,4.17789e+06,0]: skipping...
21: In predict.gstat(g, newdata = newdata, block = block, ... :
Covariance matrix singular at location [379759,4.17789e+06,0]: skipping...
22: In predict.gstat(g, newdata = newdata, block = block, ... :
Covariance matrix singular at location [380909,4.17789e+06,0]: skipping...
23: In predict.gstat(g, newdata = newdata, block = block, ... :
Covariance matrix singular at location [377459,4.17904e+06,0]: skipping...
24: In predict.gstat(g, newdata = newdata, block = block, ... :
Covariance matrix singular at location [378609,4.17904e+06,0]: skipping...
25: In predict.gstat(g, newdata = newdata, block = block, ... :
Covariance matrix singular at location [379759,4.17904e+06,0]: skipping...
26: In predict.gstat(g, newdata = newdata, block = block, ... :
Covariance matrix singular at location [380909,4.17904e+06,0]: skipping...
27: In predict.gstat(g, newdata = newdata, block = block, ... :
Covariance matrix singular at location [382059,4.17904e+06,0]: skipping...
28: In predict.gstat(g, newdata = newdata, block = block, ... :
Covariance matrix singular at location [376309,4.18019e+06,0]: skipping...
29: In predict.gstat(g, newdata = newdata, block = block, ... :
Covariance matrix singular at location [377459,4.18019e+06,0]: skipping...
30: In predict.gstat(g, newdata = newdata, block = block, ... :
Covariance matrix singular at location [378609,4.18019e+06,0]: skipping...
31: In predict.gstat(g, newdata = newdata, block = block, ... :
Covariance matrix singular at location [379759,4.18019e+06,0]: skipping...
32: In predict.gstat(g, newdata = newdata, block = block, ... :
Covariance matrix singular at location [380909,4.18019e+06,0]: skipping...
33: In predict.gstat(g, newdata = newdata, block = block, ... :
Covariance matrix singular at location [382059,4.18019e+06,0]: skipping...
34: In predict.gstat(g, newdata = newdata, block = block, ... :
Covariance matrix singular at location [383209,4.18019e+06,0]: skipping...
35: In predict.gstat(g, newdata = newdata, block = block, ... :
Covariance matrix singular at location [371709,4.18134e+06,0]: skipping...
36: In predict.gstat(g, newdata = newdata, block = block, ... :
Covariance matrix singular at location [372859,4.18134e+06,0]: skipping...
37: In predict.gstat(g, newdata = newdata, block = block, ... :
Covariance matrix singular at location [374009,4.18134e+06,0]: skipping...
38: In predict.gstat(g, newdata = newdata, block = block, ... :
Covariance matrix singular at location [375159,4.18134e+06,0]: skipping...
39: In predict.gstat(g, newdata = newdata, block = block, ... :
Covariance matrix singular at location [376309,4.18134e+06,0]: skipping...
40: In predict.gstat(g, newdata = newdata, block = block, ... :
Covariance matrix singular at location [377459,4.18134e+06,0]: skipping...
41: In predict.gstat(g, newdata = newdata, block = block, ... :
Covariance matrix singular at location [378609,4.18134e+06,0]: skipping...
42: In predict.gstat(g, newdata = newdata, block = block, ... :
Covariance matrix singular at location [379759,4.18134e+06,0]: skipping...
43: In predict.gstat(g, newdata = newdata, block = block, ... :
Covariance matrix singular at location [380909,4.18134e+06,0]: skipping...
44: In predict.gstat(g, newdata = newdata, block = block, ... :
Covariance matrix singular at location [382059,4.18134e+06,0]: skipping...
45: In predict.gstat(g, newdata = newdata, block = block, ... :
Covariance matrix singular at location [383209,4.18134e+06,0]: skipping...
46: In predict.gstat(g, newdata = newdata, block = block, ... :
Covariance matrix singular at location [384359,4.18134e+06,0]: skipping...
47: In predict.gstat(g, newdata = newdata, block = block, ... :
Covariance matrix singular at location [385509,4.18134e+06,0]: skipping...
48: In predict.gstat(g, newdata = newdata, block = block, ... :
Covariance matrix singular at location [387809,4.18134e+06,0]: skipping...
49: In predict.gstat(g, newdata = newdata, block = block, ... :
Covariance matrix singular at location [371709,4.18249e+06,0]: skipping...
50: In predict.gstat(g, newdata = newdata, block = block, ... :
Covariance matrix singular at location [372859,4.18249e+06,0]: skipping...color.pal <- colorRampPalette(c("dark red", "orange","light yellow"))
color.palr <- colorRampPalette(c("light yellow","orange","dark red"))spplot(ok.exp["var1.pred"], col.regions=color.pal) # Map Kriging predictions
Error in seq.default(zrng[1], zrng[2], length.out = cuts + 2) :
'from' must be a finite number
In addition: Warning messages:
1: In min(x) : no non-missing arguments to min; returning Inf
2: In max(x) : no non-missing arguments to max; returning -Inf
Does anyne has any idea what to fix? Thank you very much in advance!