analysing node connectivity difference in a continues scale(edge wighted by correlation value of the two nodes)

Hi everybody,

I have an edge list object weighted by a correlation value. I would like to know the changes in the node's connectivity on a continuous scale. That is how the node connectivity differs from the edge weight scale (-1) to the edge weight(+1). I would appreciate an idea of how to do it and what R package or statistical model could solve the problems etc.

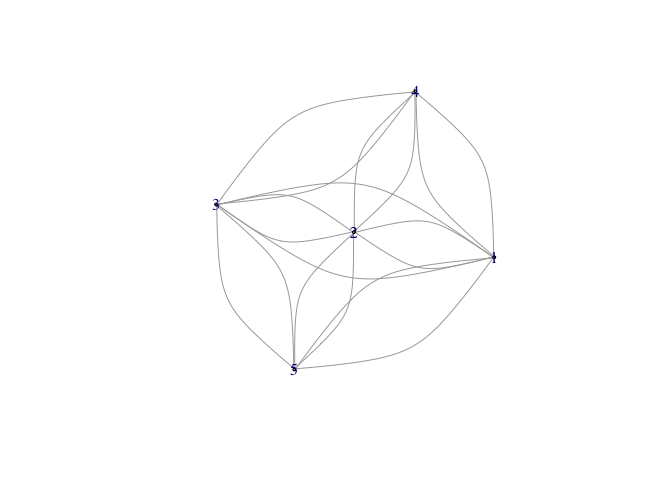
Look at the edge list object in the code below.

data <- structure(list(from = c(5L, 5L, 5L, 1L, 1L, 1L, 1L, 4L, 4L, 4L, 
                                2L, 2L, 2L, 2L, 3L, 3L, 3L, 3L), 
                       to = c(1L, 2L, 3L, 5L, 4L, 2L, 3L, 1L, 2L, 3L, 5L, 1L, 4L, 3L, 5L, 1L, 4L, 2L), 
                       weight = c(runif(18, -1,1))), 
                  row.names = c(NA, -18L), 
                  class = "data.frame")

I appreciate your help!!
Best,
Amare

Start with {igraph} and create a graph object. Here's one for a directed graph of edges.

library(igraph)
#> 
#> Attaching package: 'igraph'
#> The following objects are masked from 'package:stats':
#> 
#>     decompose, spectrum
#> The following object is masked from 'package:base':
#> 
#>     union
dat <- structure(
  list(
    from = c(
      5L, 5L, 5L, 1L, 1L, 1L, 1L, 4L, 4L, 4L,
      2L, 2L, 2L, 2L, 3L, 3L, 3L, 3L
    ),
    to = c(1L, 2L, 3L, 5L, 4L, 2L, 3L, 1L, 2L, 3L, 5L, 1L, 4L, 3L, 5L, 1L, 4L, 2L),
    weight = c(runif(18, -1, 1))
  ),
  row.names = c(NA, -18L),
  class = "data.frame"
)


net <- graph_from_data_frame(dat, directed = FALSE)

V(net)$size <- 2
plot(net)
#> Warning in v(graph): Non-positive edge weight found, ignoring all weights during
#> graph layout.

Created on 2023-01-25 with reprex v2.0.2

Decide on a measure of conductivity. At t_0 most of the vertices are connected to most of the other vertices. To express probability as edge weights, scale in the closed interval 0:1—negative weights will not work.

If you had undergraduate physics, borrow a page from quantum electrodynamics

Animation of a temporal graph from this post,

This topic was automatically closed 42 days after the last reply. New replies are no longer allowed.

If you have a query related to it or one of the replies, start a new topic and refer back with a link.