Anyone know how to keep my footer visible and on top in Shiny app? (Reprex included)

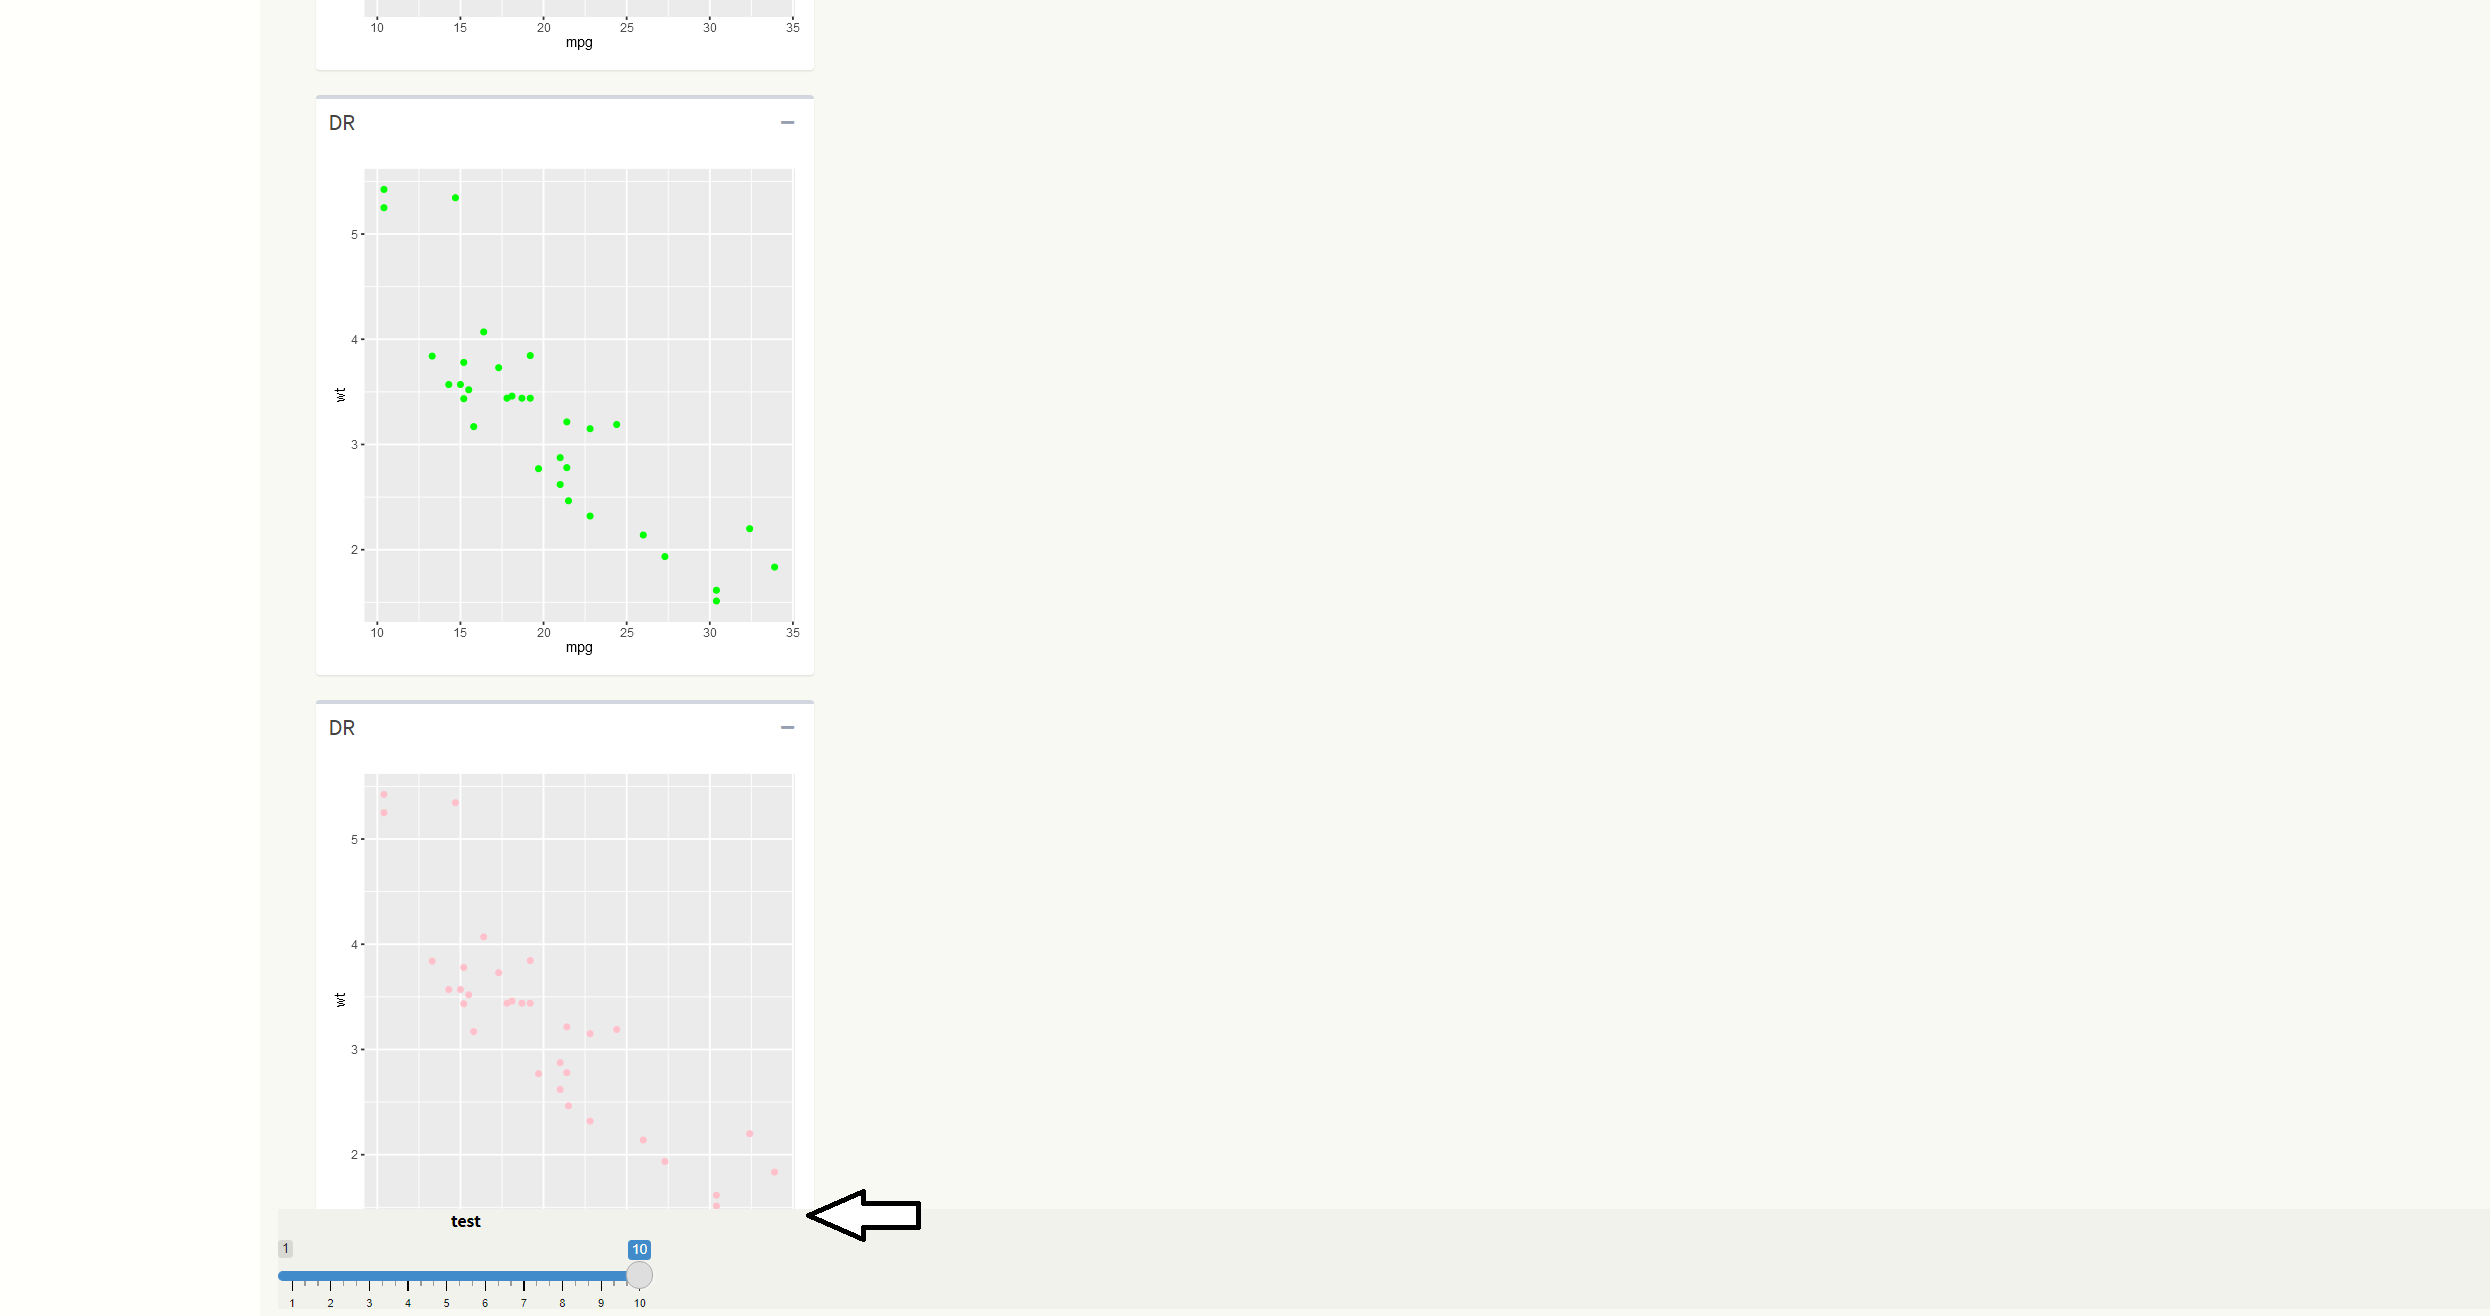
I would like to keep my footer always visible, and the scroll bar to operate on my app's content (minus the footer).

Here's a self-contained minimal reprex showing the issue:

Is it something with z-index of footer? Can't figure this one out...

#--------------------------------------------------------------
# Load libraries
library(shiny)
library(shinydashboard)
library(ggplot2)
#--------------------------------------------------------------


ui <- tagList(
  dashboardPage(


    dashboardHeader(title = "Dashboard"),
    dashboardSidebar(sidebarMenu(
      menuItem("Instructions", tabName = "genIns", icon = icon("info-circle")),
      menuItem("Data", tabName = "data", icon = icon("table"))
      
    )),
    dashboardBody(


      tags$head(tags$style(HTML('
                                /* logo */
                                .skin-blue .main-header .logo {
                                background-color: #fffffc;
                                color: #000000;
                                }
                                
                                /* logo when hovered */
                                .skin-blue .main-header .logo:hover {
                                background-color: #f9f9f4;
                                }
                                
                                /* navbar (rest of the header) */
                                .skin-blue .main-header .navbar {
                                background-color: #fffffc;
                                }
                                
                                /* main sidebar */
                                .skin-blue .main-sidebar {
                                background-color: #fffffc;
                                }
                                
                                /* active selected tab in the sidebarmenu */
                                .skin-blue .main-sidebar .sidebar .sidebar-menu .active a{
                                background-color: #eaebe6;
                                }
                                
                                /* other links in the sidebarmenu */
                                .skin-blue .main-sidebar .sidebar .sidebar-menu a{
                                background-color: #fffffc;
                                color: #000000;
                                }
                                
                                /* other links in the sidebarmenu when hovered */
                                .skin-blue .main-sidebar .sidebar .sidebar-menu a:hover{
                                background-color: #c6cdd6;
                                }
                                /* toggle button when hovered  */
                                .skin-blue .main-header .navbar .sidebar-toggle:hover{
                                background-color: #eaebe6;
                                }

                                /* body */
                                .content-wrapper, .right-side {
                                background-color: #f9f9f4;
                                }
                                
                                '))),


      tags$footer(shiny::sliderInput("myslider", "test",value=10,min=1,max=10,step=1), align = "center", style = "
              position:absolute;
              bottom:11.5px;
              width:100%;
              height:80px;   /* Height of the footer */
              color: black;
              padding: 0px;
              background-color: #f2f2ed;
              z-index: 10;"),
      
      
      tabItems(
        # First tab content
        tabItem(tabName = "genIns",
                fluidPage(
                  fluidRow(
                  column(width=6, 
                         box(plotOutput("myplot"),
                             collapsible = TRUE, 
                             title = "DR"


                         ))),
                  fluidRow(
                    column(width=6, 
                           box(plotOutput("myplot2"),
                               collapsible = TRUE, 
                               title = "DR"


                           ))),
                  fluidRow(
                    column(width=6, 
                           box(plotOutput("myplot3"),
                               collapsible = TRUE, 
                               title = "DR"


                           )))


                  )
                 
        ),
        # Second tab content
        tabItem(tabName = "data",
                sliderInput("bins",
                            "Number of bins:",
                            min = 1,
                            max = 50,
                            value = 30)
               
        )
        
      )
      
    )
    
  ),#end dashboardPage


)#end tagList


server <- shinyServer(function(input, output, session) {
  
  
  output$myplot <- renderPlot({
    p <- ggplot(mtcars, aes(x=mpg, y=wt)) + geom_point(color="red")
    
    return(p)
  })
  
  output$myplot2 <- renderPlot({
    p <- ggplot(mtcars, aes(x=mpg, y=wt)) + geom_point(color="black")
    
    return(p)
  })
  
  output$myplot3 <- renderPlot({
    p <- ggplot(mtcars, aes(x=mpg, y=wt)) + geom_point(color="green")
    
    return(p)
  })
  
  
})

shinyApp(ui, server)

EDIT:
@nirgrahamuk 's solution of using position:fixed; combined with adding a new fluidRow for some extra spacing resolved the issue.

fluidRow(
                    column(width=12,
                           HTML("<br><br><br><br>"))
                  )

I think the behaviour you want relating to position options of a HTML element is 'fixed' rather than 'absolute'

1 Like

Okay that brought me a lot closer, thanks! It introduced another problem that I don't really know where to start to solve, though.

The footer stays in place but the bottom of the page is blocked by it, covering the bottom parts of whatever is there.

For example (added one more plot to the code to illustrate)...

Any idea how to fix this?

#--------------------------------------------------------------
# Load libraries
library(shiny)
library(shinydashboard)
library(ggplot2)
#--------------------------------------------------------------


ui <- tagList(
  dashboardPage(


    dashboardHeader(title = "Dashboard"),
    dashboardSidebar(sidebarMenu(
      menuItem("Instructions", tabName = "genIns", icon = icon("info-circle")),
      menuItem("Data", tabName = "data", icon = icon("table"))
      
    )),
    dashboardBody(


      tags$head(tags$style(HTML('
                                /* logo */
                                .skin-blue .main-header .logo {
                                background-color: #fffffc;
                                color: #000000;
                                }
                                
                                /* logo when hovered */
                                .skin-blue .main-header .logo:hover {
                                background-color: #f9f9f4;
                                }
                                
                                /* navbar (rest of the header) */
                                .skin-blue .main-header .navbar {
                                background-color: #fffffc;
                                }
                                
                                /* main sidebar */
                                .skin-blue .main-sidebar {
                                background-color: #fffffc;
                                }
                                
                                /* active selected tab in the sidebarmenu */
                                .skin-blue .main-sidebar .sidebar .sidebar-menu .active a{
                                background-color: #eaebe6;
                                }
                                
                                /* other links in the sidebarmenu */
                                .skin-blue .main-sidebar .sidebar .sidebar-menu a{
                                background-color: #fffffc;
                                color: #000000;
                                }
                                
                                /* other links in the sidebarmenu when hovered */
                                .skin-blue .main-sidebar .sidebar .sidebar-menu a:hover{
                                background-color: #c6cdd6;
                                }
                                /* toggle button when hovered  */
                                .skin-blue .main-header .navbar .sidebar-toggle:hover{
                                background-color: #eaebe6;
                                }

                                /* body */
                                .content-wrapper, .right-side {
                                background-color: #f9f9f4;
                                }


                                '))),


      tags$footer(shiny::sliderInput("myslider", "test",value=10,min=1,max=10,step=1), align = "center", style = "
              position:fixed;
              bottom:11.5px;
              width:100%;
              height:80px;   /* Height of the footer */
              color: black;
              padding: 0px;
              background-color: #f2f2ed;
              z-index: 100;"),
      
      
      tabItems(
        # First tab content
        tabItem(tabName = "genIns",
                fluidPage(
                  fluidRow(
                  column(width=6, 
                         box(plotOutput("myplot"),
                             collapsible = TRUE, 
                             title = "DR"


                         ))),
                  fluidRow(
                    column(width=6, 
                           box(plotOutput("myplot2"),
                               collapsible = TRUE, 
                               title = "DR"


                           ))),
                  fluidRow(
                    column(width=6, 
                           box(plotOutput("myplot3"),
                               collapsible = TRUE, 
                               title = "DR"


                           ))),
                  
                  fluidRow(
                    column(width=6, 
                           box(plotOutput("myplot4"),
                               collapsible = TRUE, 
                               title = "DR"


                           )))


                  )
                 
        ),
        # Second tab content
        tabItem(tabName = "data",
                sliderInput("bins",
                            "Number of bins:",
                            min = 1,
                            max = 50,
                            value = 30)
               
        )
        
      )
      
    )
    
  ),#end dashboardPage


)#end tagList


server <- shinyServer(function(input, output, session) {
  
  
  output$myplot <- renderPlot({
    p <- ggplot(mtcars, aes(x=mpg, y=wt)) + geom_point(color="red")
    
    return(p)
  })
  
  output$myplot2 <- renderPlot({
    p <- ggplot(mtcars, aes(x=mpg, y=wt)) + geom_point(color="black")
    
    return(p)
  })
  
  output$myplot3 <- renderPlot({
    p <- ggplot(mtcars, aes(x=mpg, y=wt)) + geom_point(color="green")
    
    return(p)
  })
  
  output$myplot4 <- renderPlot({
    p <- ggplot(mtcars, aes(x=mpg, y=wt)) + geom_point(color="pink")
    
    return(p)
  })
  
  
})

shinyApp(ui, server)

This topic was automatically closed 7 days after the last reply. New replies are no longer allowed.

If you have a query related to it or one of the replies, start a new topic and refer back with a link.