HI R Community,
I have created a shiny app where I need to track number of surveys happening daily. In the filter I have given dateInput. But the app does not work. I need multiple selection in date filter. So I have two issues:
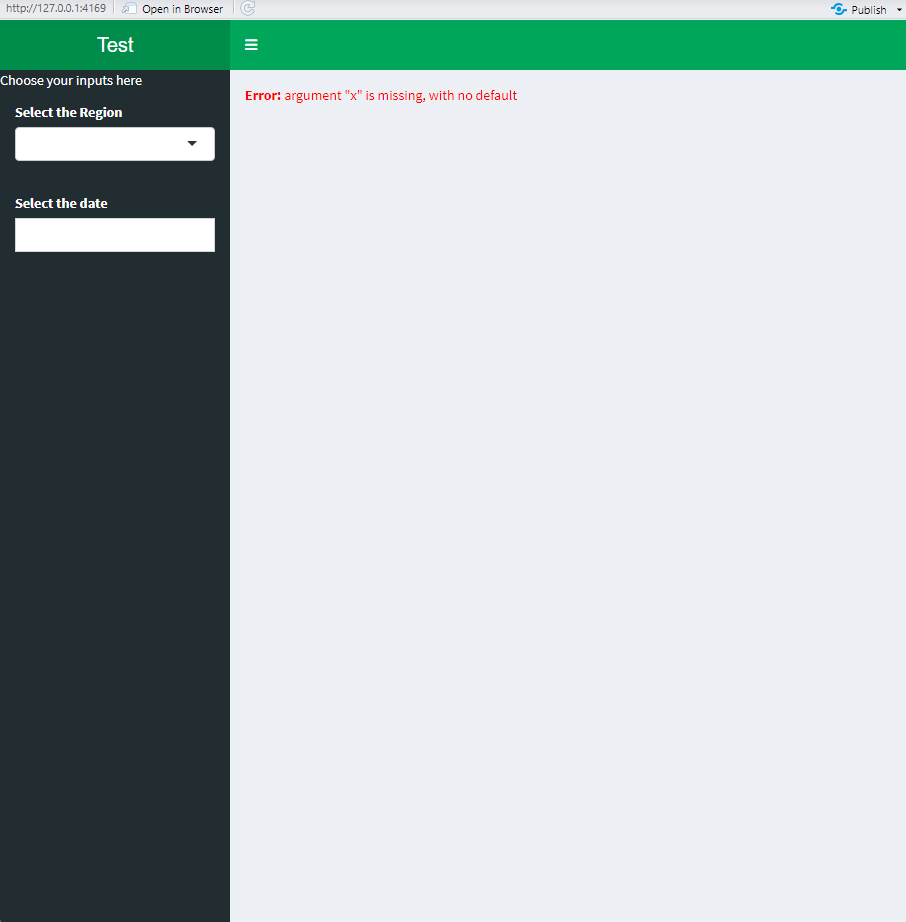
Multiple date selection and date does not appear properly.
The line graph shows an error message (the screenshot I have attached below).
your main error/issue I think comes from your use of num() but num is not a function, nor a reactive function, its just the data data.frame that was grouped and summarised, i.e its a normal static data.frame
Oops, I forgot to add the reactive function. I have formatted the date as given by you. But the problem still persists. The date does not come in as required and neither does the plot.
library(tidyverse)
library(shiny)
library(plotly)
#>
#> Attaching package: 'plotly'
#> The following object is masked from 'package:ggplot2':
#>
#>     last_plot
#> The following object is masked from 'package:stats':
#>
#>     filter
#> The following object is masked from 'package:graphics':
#>
#>     layout
library(shinydashboard)
#>
#> Attaching package: 'shinydashboard'
#> The following object is masked from 'package:graphics':
#>
#>     box
data<-tibble::tribble(
            ~region,        ~date,
          "Hubli U", "02-04-2022",
          "Hubli R", "02-04-2022",
        "Dharwad R", "02-04-2022",
        "Dharwad U", "03-04-2022",
          "Hubli R", "04-04-2022",
          "Hubli U", "04-04-2022",
        "Dharwad R", "05-04-2022",
        "Dharwad U", "05-04-2022",
          "Hubli R", "05-04-2022",
          "Hubli U", "05-04-2022"
        )

data<-data %>% mutate(date=as.Date(date,"%d-%m-%Y"))


ui<-dashboardPage(
  skin = "green",
  dashboardHeader(title = "Test"),
  dashboardSidebar("Choose your inputs here",
                   selectInput("region","Select the Region",choices = data$region),
                   dateInput("date","Select the date",min = min(data$date),max = max(data$date))),
  dashboardBody(plotlyOutput("plot1"))
)

server<-function(input,output,session){
  num<-reactive({
    data %>%
      group_by(date) %>%
      summarise(number=n()) %>%
      filter(region %in% input$region)
  })

  output$plot1<-renderPlotly({
      plot1<-ggplot(num(),aes(input$date,number))+
      geom_line(size=1.5)

      ggplotly(plot1)
  })
}

shinyApp(ui,server)
#> PhantomJS not found. You can install it with webshot::install_phantomjs(). If it is installed, please make sure the phantomjs executable can be found via the PATH variable.
Shiny applications not supported in static R Markdown documents
Created on 2022-10-24 by the reprex package (v2.0.1)