Hi all,
Thank you in advance for your time
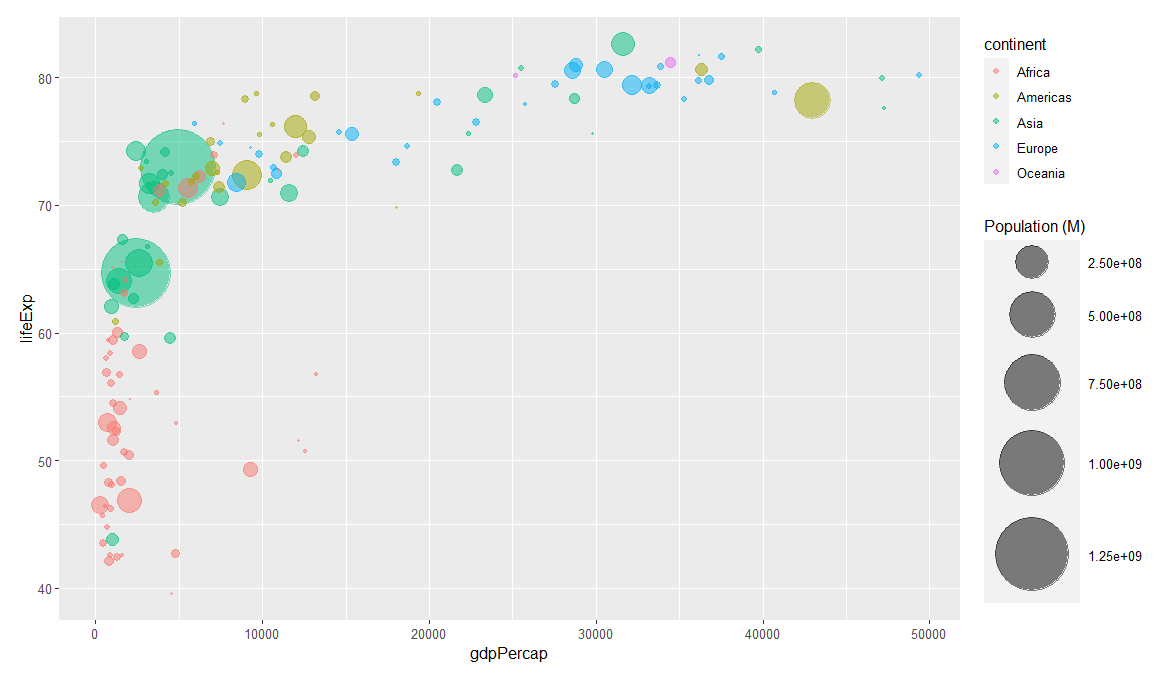
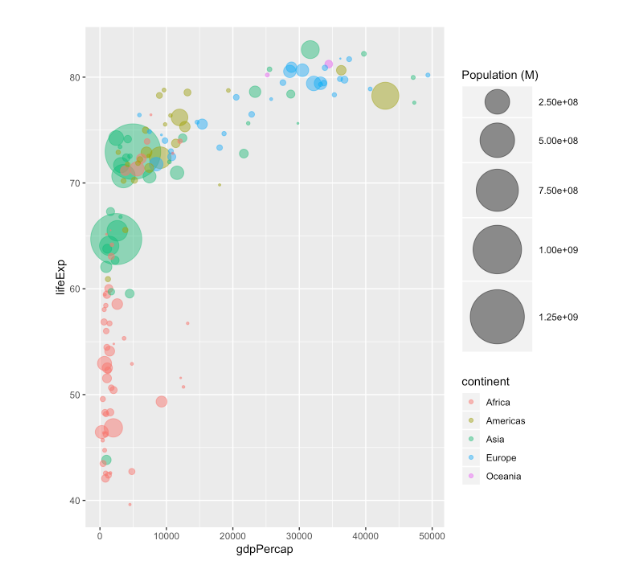
Based on a basic bubble plot with legends for size and fill of the circles.
How can I arrange the code so the generated plot will present always the legend in a certain order.
for example, given the plot, how can I make sure the legend for continent goes before population?
# Libraries
library(ggplot2)
library(dplyr)

# The dataset is provided in the gapminder library
library(gapminder)
data <- gapminder %>% filter(year=="2007") %>% dplyr::select(-year)

# Most basic bubble plot
data %>%
  arrange(desc(pop)) %>%
  mutate(country = factor(country, country)) %>%
  ggplot(aes(x=gdpPercap, y=lifeExp, size=pop, color=continent)) +
    geom_point(alpha=0.5) +
    scale_size(range = c(.1, 24), name="Population (M)")