I am following this tutorial for a random forest (RF) regression task. At some point (around in the middle of the webpage), the authors they tune multiple RF models and then they sort them based on their RMSE (from lowest to highest), like so:
for(i in 1:nrow(hyper_grid)) {

  # train model
  model <- ranger(
    formula         = Sale_Price ~ .,
    data            = ames_train,
    num.trees       = 500,
    mtry            = hyper_grid$mtry[i],
    min.node.size   = hyper_grid$node_size[i],
    sample.fraction = hyper_grid$sampe_size[i],
    seed            = 123
  )

  # add OOB error to grid
  hyper_grid$OOB_RMSE[i] <- sqrt(model$prediction.error)
}

hyper_grid %>%
  dplyr::arrange(OOB_RMSE) %>%
  head(10)
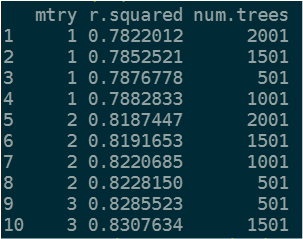
My goal is to use the r-squared as a validation method and not the RMSE. So when I change their code and and I try to sort the models (from highest to lowest r-squared) I'm getting the inverse results (from lowest to highest). How should I syntax the code in order my table to start from the model with the highest r-squared?
library(randomForest)
library(rsample)      # data splitting
library(ranger)       # a faster implementation of randomForest
library(dplyr)

wd = "path/"

# Load the data
block.data <- read.csv(paste0(wd, "block.data.csv"))

eq1 = ntl ~ .

set.seed(123)
block.data_split <- initial_split(block.data, prop = .65)
dftrain <- training(block.data_split)
dftest  <- testing(block.data_split)

# names of features
features <- setdiff(names(dftrain), "ntl")

# tuning
# hyperparameter grid search
hyper_grid <- expand.grid(
  mtry = seq(1, 3, by = 1),
  r.squared = 0,
  num.trees = seq(501, 2001, by = 500)
)

# total number of combinations
nrow(hyper_grid)

# perform grid search
for(i in 1:nrow(hyper_grid)) {
  # train model
  model <- ranger(
    formula         = eq1,
    data            = dftrain,
    mtry            = hyper_grid$mtry[i],
    num.trees       = hyper_grid$num.trees[i],
    seed            = 345
  )

  # add OOB r-squared to grid
  hyper_grid$r.squared[i] <- (model$r.squared)
}

hyper_grid %>%
  dplyr::arrange(r.squared) %>%
  head(10)
And I get this result:
Here is the data.frame:
block.data = structure(list(ntl = c(11.4058170318604, 13.7000455856323, 16.0420398712158,
17.4475727081299, 26.263370513916, 30.658130645752, 19.8927211761475,
20.917688369751, 23.7149887084961, 25.2641334533691, 24.551607131958,
25.1800746917725, 21.3976306915283, 10.5321912765503, 5.65721082687378,
24.5314807891846, 26.1219844818115, 29.624231338501, 31.8403453826904,
27.9622707366943, 18.0667095184326, 7.9408917427063, 4.72970390319824,
3.95170521736145, 21.5960903167725, 25.2520027160645, 29.8979358673096,
31.5415306091309, 25.0444297790527, 14.8668518066406), pop = c(117.980590820312,
141.15837097168, 160.490631103516, 179.857696533203, 333.754943847656,
386.515899658203, 200.744140625, 291.138031005859, 341.913787841797,
349.522674560547, 349.463409423828, 329.562561035156, 357.680541992188,
126.797996520996, 53.7180137634277, 367.29150390625, 397.941589355469,
441.192077636719, 439.492248535156, 400.470642089844, 326.854431152344,
97.7923202514648, 50.0843887329102, 30.9873847961426, 405.128997802734,
414.620361328125, 483.053039550781, 453.343353271484, 434.569305419922,
223.394119262695), tirs = c(35.4003829956055, 34.3513221740723,
33.4806861877441, 34.9035949707031, 41.4693984985352, 39.5647201538086,
39.0728454589844, 36.8901824951172, 37.6309623718262, 35.9091033935547,
35.9297790527344, 36.6264877319336, 39.7098388671875, 34.9120330810547,
32.9063835144043, 37.8504333496094, 36.7989921569824, 37.1495933532715,
37.820198059082, 38.9393043518066, 39.8676147460938, 37.7171325683594,
33.4802207946777, 31.2874813079834, 38.6301002502441, 35.4951019287109,
36.3624992370605, 38.8732681274414, 39.972412109375, 39.5605201721191
), agbh = c(0.650510787963867, 0.0705224648118019, 0.414034515619278,
0.445279210805893, 4.15855550765991, 5.4627046585083, 1.90679943561554,
4.45461750030518, 2.09545969963074, 4.74866056442261, 2.7669403553009,
1.06939005851746, 5.11670589447021, 0.115469247102737, 0.000922230829019099,
5.67093515396118, 7.21718788146973, 5.69155311584473, 6.41495084762573,
2.41367149353027, 3.95964455604553, 0.529372036457062, 0.0152123104780912,
0, 4.75090169906616, 5.61534833908081, 7.13258028030396, 6.94204378128052,
5.23749208450317, 2.67384099960327)), class = "data.frame", row.names = c(NA,
-30L))