Assign specific signature to the specific data value within the treatment

Hi R-Community,

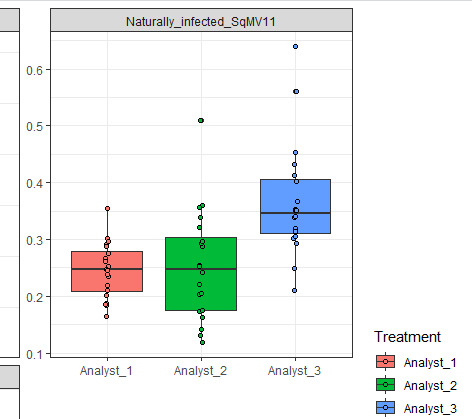
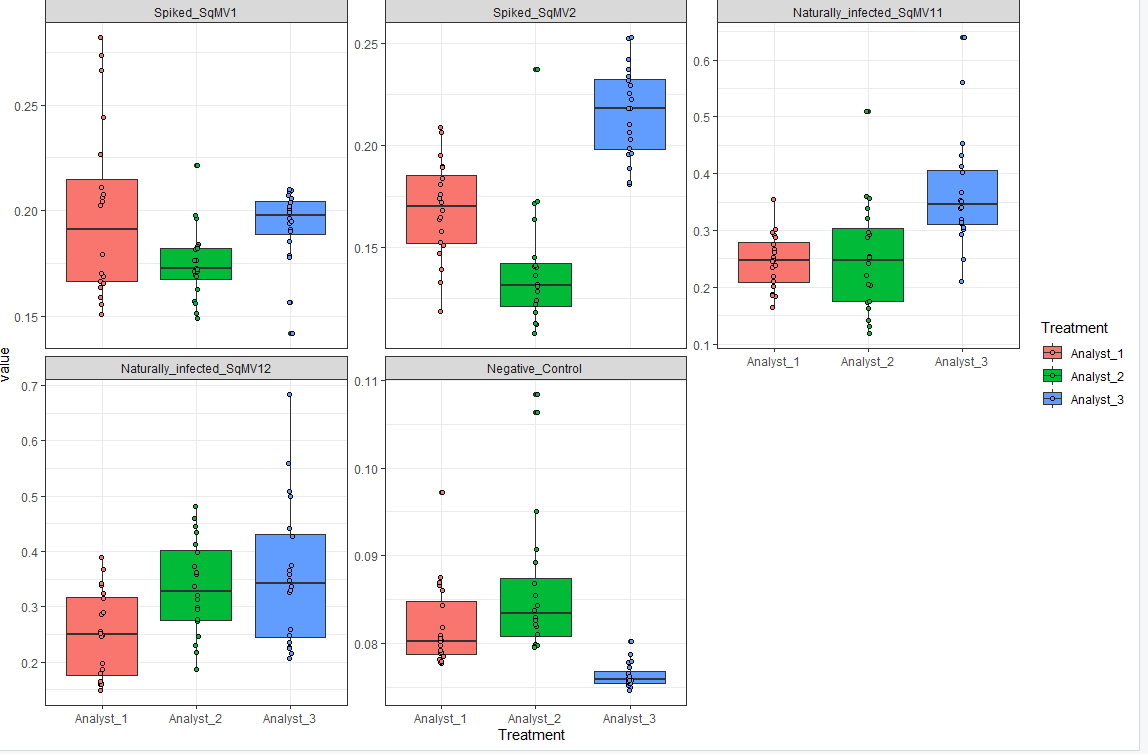
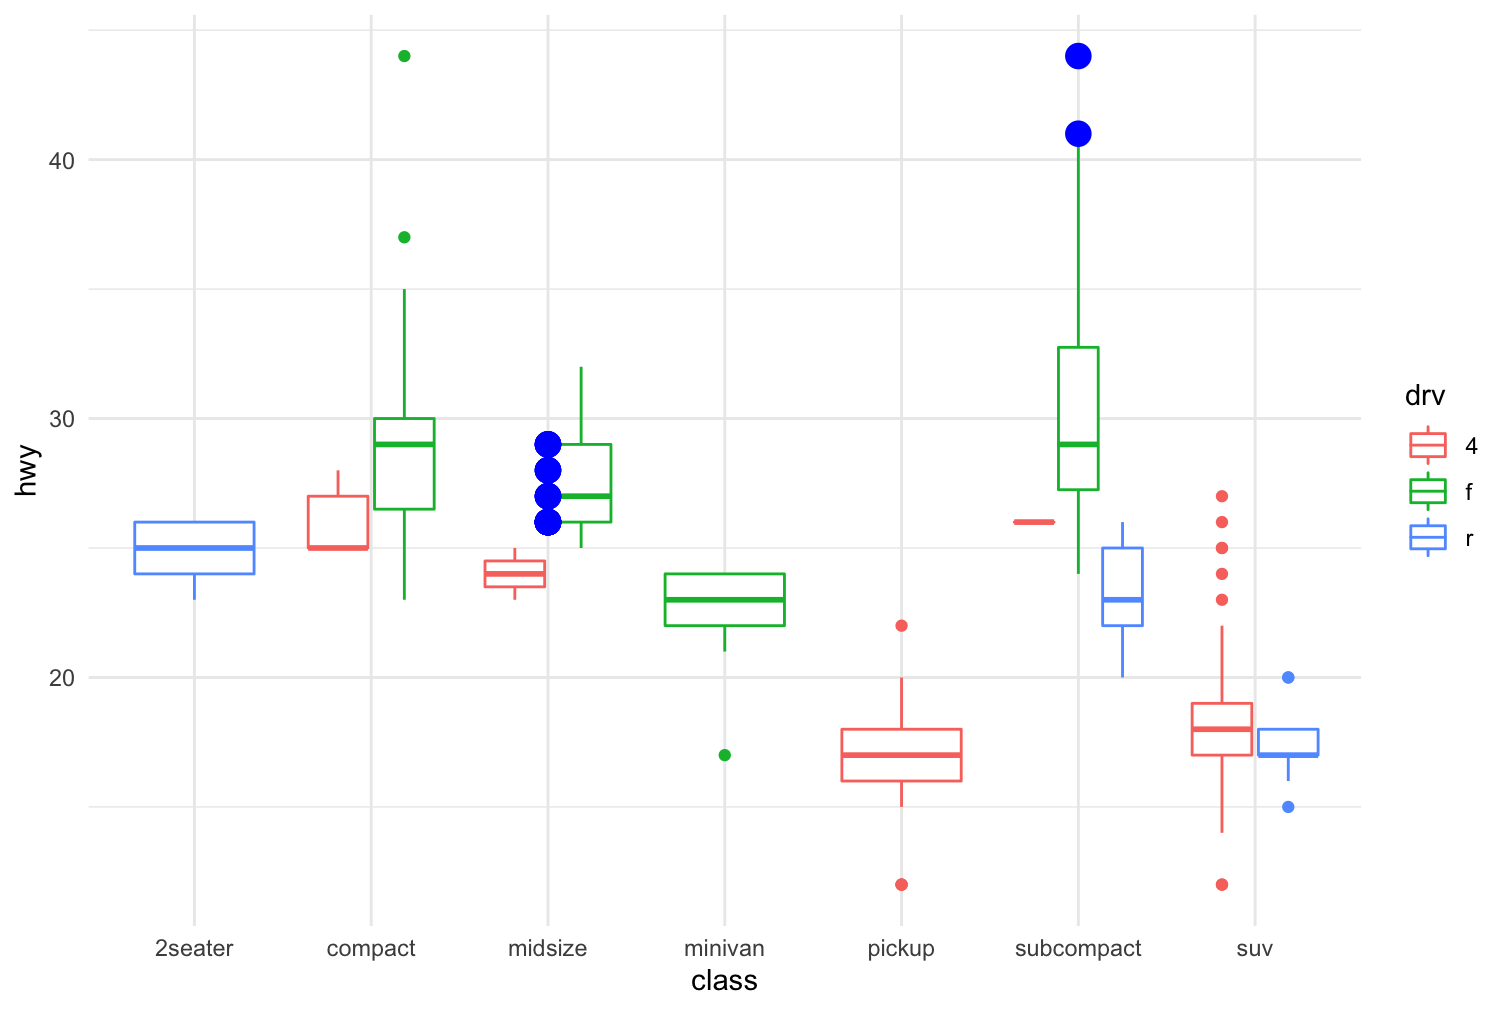
I plotted a boxplot using ggplot2 library as attached below. Now, I am interested in highlighting specific data values with in the treatment. How can I accomplish this? For example, I want to change the color of specific data point for analyst_2 and different specific data point for analyst_1.

Any help will be highly appreciated!

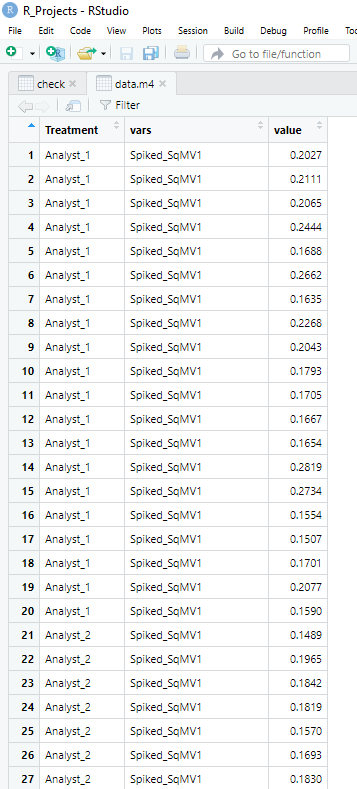
I code I use to generate the plot is below:
ggplot(data.m4, aes(x = Treatment, y = value, fill = Treatment)) + geom_boxplot(position = position_dodge(width = 0.7)) + facet_wrap(~vars, scales = "free_y") + geom_point(position = position_jitterdodge(jitter.width = 0.1, dodge.width = 0.7), aes(fill = Treatment), pch = 21) + theme_bw()

image

1 Like
library(ggplot2)
p <- ggplot(mpg, aes(class, hwy))
p + geom_boxplot(aes(colour = drv)) + 
  geom_point( 
    data = mpg[which(mpg$hwy > 40),], 
    aes(class,hwy),
    color="blue", size=4, show.legend = FALSE) +
  theme_minimal()

Thank you prompt reply, I highly appreciate it. How can I specify different values in different treatment. For example, anything >40 in sub compact and value between 25 to 30 in midsize.

Thank you so much in advance.

@technocrat - I am attaching my data for your reference. I want to specify data values below 0.17 in spiked_SqMV2 Analyst_2 and data values below 0.2 in Naturally_infected_SqMV12 in Analyst_1 only.

See the FAQ: How to do a minimal reproducible example reprex for beginners. A screenshot is not a good substitute for representative data, so I'll have to make some assumptions.

For a data frame named Dat with fields spiked_SqMV2, Naturally_infected_SqMV12, Analyst_2 and Analyst_1, I'm going to use S,N,A1 and A2 for convenience. To select only those points that meet criteria described involves a Boolean logical specification.

(S < 0.17 \& A\ 2) \& (S < 0.2 \& A1)

To implement that in R, we can subset my_data

my_data[which((S< 0.17 &  A1) & (N < 0.2 & A2)),]

This assumes that A1 and A2 are typeof logical`

@technocrat Thank you so much.

I tried couple of different ways - did not work. I've attached demo datasheet and code error. One of closest example I've found is r - subsetting points in a faceted plot using position_jitterdodge - Stack Overflow but in this case the cutoff was set same of all treatments.

Thank you!

What code did you try with which() since the variables are different from what I had to assume?

Maybe, if you are more comfortable, you can create a new data frame that contains the desired values.
For example:

# anything >40 in sub compact and value between 25 to 30 in midsize
interesting <- mpg %>%
  filter((class == "subcompact" & hwy > 40) |
         (class == "midsize" & hwy > 25 & hwy < 30))

mpg %>% 
  ggplot(aes(class, hwy)) +
  geom_boxplot(aes(colour = drv)) +
  geom_point(data = interesting, aes(class, hwy), color = "blue", size = 4, show.legend = F, inherit.aes = F) +
  theme_minimal()

@Flm - I am highly thankful for the community helping me to fix the bug. Here is the code error

p <- ggplot(data.m4, aes(x = Treatment, y = value, color = Treatment)) + facet_wrap(~vars, scales = "free_y")+ geom_jitter(position=position_jitter(0.2)) This is what I used for my plots

check_filter <- data.m4 %>%filter ((class == "Analyst_2" & value < 0.15 ))

For example, in the facet_wrap plot, I am interested giving different size of specific values in spiked_SqMV2 plot to Analyst_2 only.

Here is the facet_wrap plot for demo data

Can you paste the output dput(head(data.m4, 20)) to debug?

Of course: Here it is

Please paste the code here instead of the screenshot so that I can use it in Rstudio

2 Likes

Here it is

dput(head(data.m4, 20))
structure(list(Treatment = structure(c(1L, 1L, 1L, 1L, 1L, 1L,
1L, 1L, 1L, 1L, 1L, 1L, 1L, 1L, 1L, 1L, 1L, 1L, 1L, 1L), levels = c("Analyst_1",
"Analyst_2", "Analyst_3"), class = "factor"), vars = structure(c(1L,
1L, 1L, 1L, 1L, 1L, 1L, 1L, 1L, 1L, 1L, 1L, 1L, 1L, 1L, 1L, 1L,
1L, 1L, 1L), levels = c("Spiked_SqMV1", "Spiked_SqMV2", "Naturally_infected_SqMV11",
"Naturally_infected_SqMV12", "Negative_Control"), class = "factor"),
value = c(0.2027, 0.2111, 0.2065, 0.2444, 0.1688, 0.2662,
0.1635, 0.2268, 0.2043, 0.1793, 0.1705, 0.1667, 0.1654, 0.2819,
0.2734, 0.1554, 0.1507, 0.1701, 0.2077, 0.159)), row.names = c(NA,
20L), class = "data.frame")

The problem is here: class == "Analyst_2" .
You have to use Treatment == "Analyst_2"

For example:

check_filter <- data.m4 %>%
  filter(Treatment == "Analyst_1" & value > 0.25)


# A tibble: 3 × 3
  Treatment vars         value
  <fct>     <fct>        <dbl>
1 Analyst_1 Spiked_SqMV1 0.266
2 Analyst_1 Spiked_SqMV1 0.282
3 Analyst_1 Spiked_SqMV1 0.273
> 

Code I used:

library(tidyverse)

data.m4 <- structure(list(Treatment=structure(c(1L,1L,1L,1L,1L,1L,
1L,1L,1L,1L,1L,1L,1L,1L,1L,1L,1L,1L,1L,1L),levels=c("Analyst_1",
"Analyst_2","Analyst_3"),class="factor"),vars=structure(c(1L,
1L,1L,1L,1L,1L,1L,1L,1L,1L,1L,1L,1L,1L,1L,1L,1L,
1L,1L,1L),levels=c("Spiked_SqMV1","Spiked_SqMV2","Naturally_infected_SqMV11",
"Naturally_infected_SqMV12","Negative_Control"),class="factor"),
value=c(0.2027,0.2111,0.2065,0.2444,0.1688,0.2662,
0.1635,0.2268,0.2043,0.1793,0.1705,0.1667,0.1654,0.2819,
0.2734,0.1554,0.1507,0.1701,0.2077,0.159)),row.names=c(NA,
20L),class="data.frame") %>% 
as_tibble()

data.m4 %>% 
  ggplot(aes(x = Treatment, y = value, color = Treatment)) + 
  facet_wrap(~vars, scales = "free_y") + 
  geom_jitter(position=position_jitter(0.2))

check_filter <- data.m4 %>%
  filter(Treatment == "Analyst_1" & value < 0.15 )

Thank you @Flm - the code worked but raise another issue. I highlighted (black boarder) the data points in question that I would need but there are some data value within the cutoff range that were not highlighted as said in the code (two data points in this case).

The code I use is
data.m4 %>%ggplot(aes(x = Treatment, y = value, color = Treatment)) + facet_wrap(~vars, scales = "free_y") + geom_jitter(position=position_jitter(0.2)) + geom_point(data = . %>% filter(Treatment == "Analyst_1", vars == "Spiked_SqMV2" & value < 0.15 ), size=4, color="black") + geom_point()

Run your code data.m4 %>% filter(Treatment == "Analyst_1", vars == "Spiked_SqMV2" & value < 0.15 ) in console and check out the output. Is that what you expect or is it how it looks in the graph?

That syntax means: take only values that meet the following conditions (all of them):

  1. Treatment must be equal to "Analyst_1"
    AND at the same time
  2. vars must be equal to "Spiked_SqMV2"
    AND at the same time
  3. value must be less than .15

EDIT:
oh, I didn't notice. geom_point may have overlapped the points, on the contrary geom_ jitter may have offset them.
Plus you also used geom_point () by itself. Remove it.


Edit2:
another approach can be:

data.m4 %>%
  mutate(is_interesting = case_when(
    Treatment == "Analyst_1" & value < 0.2 ~ T,
    T ~ F
  )) %>% 
  ggplot(aes(x = Treatment, y = value, color = interaction(Treatment, is_interesting))) + 
  facet_wrap(~vars, scales = "free_y") + 
  geom_point(position = position_jitter(seed = 42)) +
  scale_color_manual()
1 Like

Thank you so much - all sorted now. geom_jitters were overlapping on geom_points.

Code I used:
p <- data.m4 %>%ggplot(aes(x = Treatment, y = value, color = Treatment)) + facet_wrap(~vars, scales = "free_y") + geom_point(data = . %>% filter(Treatment == "Analyst_1", vars == "Spiked_SqMV2" & value < 0.15 ), size=4, color="black") + geom_point() + geom_point(data = . %>% filter(Treatment == "Analyst_2", vars == "Spiked_SqMV2" & value < 0.12 ), size=4, color="black") + geom_point()

p + geom_point(data = . %>% filter(Treatment == "Analyst_1", vars == "Naturally_infected_SqMV12" & value < 0.2 ), size=4, color="black") + geom_point()

1 Like

Excellent, if you have any further need please ask, otherwise you can mark the answer if this has satisfied you

2 Likes

This topic was automatically closed 7 days after the last reply. New replies are no longer allowed.

If you have a query related to it or one of the replies, start a new topic and refer back with a link.