Axis limits with facet_grid

Hi,

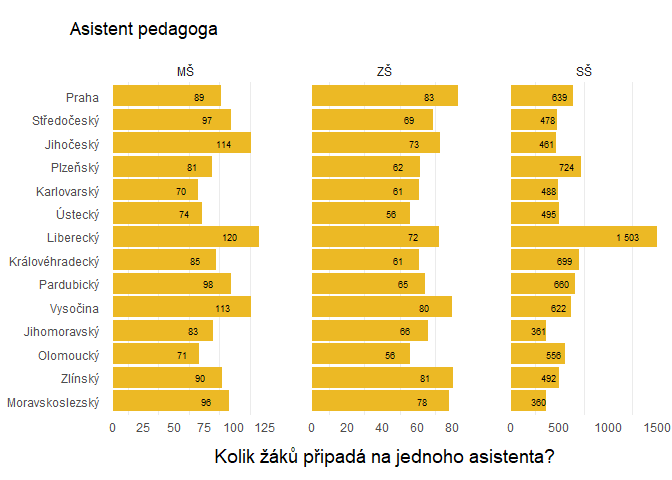
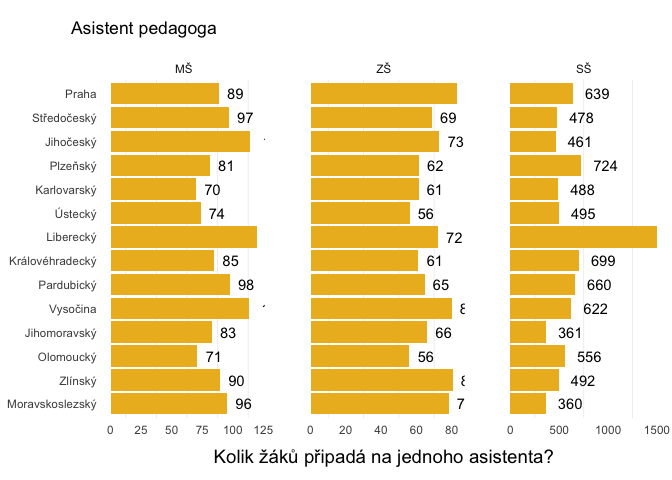
I'm lookint for a way how to set manually x-axis limits while using facet_grid so that all labels fit in the graph. Any suggestions?

library(ggplot2)
data <- structure(list(kraj = structure(c(1L, 2L, 3L, 4L, 5L, 6L, 7L, 
                                          8L, 9L, 10L, 11L, 12L, 13L, 14L, 1L, 2L, 3L, 4L, 5L, 6L, 7L, 
                                          8L, 9L, 10L, 11L, 12L, 13L, 14L, 1L, 2L, 3L, 4L, 5L, 6L, 7L, 
                                          8L, 9L, 10L, 11L, 12L, 13L, 14L), levels = c("Moravskoslezský", 
                                                                                       "Zlínský", "Olomoucký", "Jihomoravský", "Vysočina", "Pardubický", 
                                                                                       "Královéhradecký", "Liberecký", "Ústecký", "Karlovarský", 
                                                                                       "Plzeňský", "Jihočeský", "Středočeský", "Praha"), class = "factor"), 
                       stupen = structure(c(1L, 1L, 1L, 1L, 1L, 1L, 1L, 1L, 1L, 
                                            1L, 1L, 1L, 1L, 1L, 2L, 2L, 2L, 2L, 2L, 2L, 2L, 2L, 2L, 2L, 
                                            2L, 2L, 2L, 2L, 3L, 3L, 3L, 3L, 3L, 3L, 3L, 3L, 3L, 3L, 3L, 
                                            3L, 3L, 3L), levels = c("MŠ", "ZŠ", "SŠ"), class = "factor"), 
                       hodnota = c(95.5141684189446, 89.6939469508048, 71.068516021319, 
                                   82.8160908055395, 113.438481759313, 97.6213803614196, 84.9435093382523, 
                                   120.074590562672, 73.5647365996007, 70.0403496973773, 81.3885168704368, 
                                   114.115207606332, 96.8781678242913, 88.6877828054299, 78.2735441654197, 
                                   80.5813294470083, 56.0609659131979, 66.2391142075143, 79.9778085991678, 
                                   64.7308068801566, 61.1567445365486, 72.2020034592101, 56.1278932608407, 
                                   61.1904640878361, 61.5100335857279, 73.0561657925815, 68.8813042446519, 
                                   83.1930706385988, 360.372604413224, 492.059955438525, 555.546391752577, 
                                   361.131288153929, 622.225647348952, 660.484594675441, 699.131513647643, 
                                   1503.41643582641, 495.114106294992, 488.072965388213, 723.768115942029, 
                                   460.993975903614, 477.54690097364, 638.553525303741)), row.names = c(NA, 
                                                                                                        -42L), class = c("tbl_df", "tbl", "data.frame"))


ggplot(data, aes(y = kraj, x = hodnota,
                     label = scales::comma(hodnota, accuracy = 1, scale = 1, prefix = "", suffix = "",
                                           big.mark = " ", decimal.mark = ","))) +
  geom_col(fill = "#ECB925") +
  geom_text(hjust=-.5)+
  theme_minimal() +
  theme(legend.position = 'none',
        legend.title = element_blank(),
        plot.title = element_text(margin=margin(10,0,15,0),
                                  hjust = 0.125),
        plot.title.position = "plot", 
        plot.caption.position =  "plot",
        axis.title.y=element_blank(),
        axis.title.x=element_text(size=14,
                                  margin = margin(10,
                                                  0,
                                                  5,
                                                  0)),
        panel.grid.major = element_blank(),
        panel.spacing = unit(2, "lines"),
        strip.text.y = element_text(angle = 0, size = 15)
  ) +
  ggtitle("Asistent pedagoga") +
  xlab("Kolik žáků připadá na jednoho asistenta?") +
  facet_grid(cols = vars(stupen), scales = "free") 

image

Many thanks,

Jakub

Hi @Jakub_Komarek,
How about moving the value labels on top of the bars (saving space)?

library(ggplot2)
data <- structure(list(kraj = structure(c(1L, 2L, 3L, 4L, 5L, 6L, 7L, 
                                          8L, 9L, 10L, 11L, 12L, 13L, 14L, 1L, 2L, 3L, 4L, 5L, 6L, 7L, 
                                          8L, 9L, 10L, 11L, 12L, 13L, 14L, 1L, 2L, 3L, 4L, 5L, 6L, 7L, 
                                          8L, 9L, 10L, 11L, 12L, 13L, 14L), levels = c("Moravskoslezský", 
                                                                                       "Zlínský", "Olomoucký", "Jihomoravský", "Vysočina", "Pardubický", 
                                                                                       "Královéhradecký", "Liberecký", "Ústecký", "Karlovarský", 
                                                                                       "Plzeňský", "Jihočeský", "Středočeský", "Praha"), class = "factor"), 
                       stupen = structure(c(1L, 1L, 1L, 1L, 1L, 1L, 1L, 1L, 1L, 
                                            1L, 1L, 1L, 1L, 1L, 2L, 2L, 2L, 2L, 2L, 2L, 2L, 2L, 2L, 2L, 
                                            2L, 2L, 2L, 2L, 3L, 3L, 3L, 3L, 3L, 3L, 3L, 3L, 3L, 3L, 3L, 
                                            3L, 3L, 3L), levels = c("MŠ", "ZŠ", "SŠ"), class = "factor"), 
                       hodnota = c(95.5141684189446, 89.6939469508048, 71.068516021319, 
                                   82.8160908055395, 113.438481759313, 97.6213803614196, 84.9435093382523, 
                                   120.074590562672, 73.5647365996007, 70.0403496973773, 81.3885168704368, 
                                   114.115207606332, 96.8781678242913, 88.6877828054299, 78.2735441654197, 
                                   80.5813294470083, 56.0609659131979, 66.2391142075143, 79.9778085991678, 
                                   64.7308068801566, 61.1567445365486, 72.2020034592101, 56.1278932608407, 
                                   61.1904640878361, 61.5100335857279, 73.0561657925815, 68.8813042446519, 
                                   83.1930706385988, 360.372604413224, 492.059955438525, 555.546391752577, 
                                   361.131288153929, 622.225647348952, 660.484594675441, 699.131513647643, 
                                   1503.41643582641, 495.114106294992, 488.072965388213, 723.768115942029, 
                                   460.993975903614, 477.54690097364, 638.553525303741)), row.names = c(NA, 
                                                                                                        -42L), class = c("tbl_df", "tbl", "data.frame"))
move_x <- -(0.2*data$hodnota)

ggplot(data, aes(y = kraj, x = hodnota,
                     label = scales::comma(hodnota, accuracy = 1, scale = 1, prefix = "", suffix = "",
                                           big.mark = " ", decimal.mark = ","))) +
  geom_col(fill = "#ECB925") +
  #geom_text(hjust=-.5)+
  geom_text(nudge_x=move_x, cex=2.5)+
  theme_minimal() +
  theme(legend.position = 'none',
        legend.title = element_blank(),
        plot.title = element_text(margin=margin(10,0,15,0),
                                  hjust = 0.125),
        plot.title.position = "plot", 
        plot.caption.position =  "plot",
        axis.title.y=element_blank(),
        axis.title.x=element_text(size=14,
                                  margin = margin(10,
                                                  0,
                                                  5,
                                                  0)),
        panel.grid.major = element_blank(),
        panel.spacing = unit(2, "lines"),
        strip.text.y = element_text(angle = 0, size = 15)
  ) +
  ggtitle("Asistent pedagoga") +
  xlab("Kolik žáků připadá na jednoho asistenta?") +
  facet_grid(cols = vars(stupen), scales = "free") 

Created on 2022-11-07 with reprex v2.0.2

1 Like

thank you for a suggestion but it is not a solution I'm looking for.

Add this into the ggplot call:

+ coord_cartesian(clip = "off") 

If that doesn't work expand the x axis scale.

2 Likes

This topic was automatically closed 7 days after the last reply. New replies are no longer allowed.

If you have a query related to it or one of the replies, start a new topic and refer back with a link.