Bar chart with intervals in X-axis

Hi,
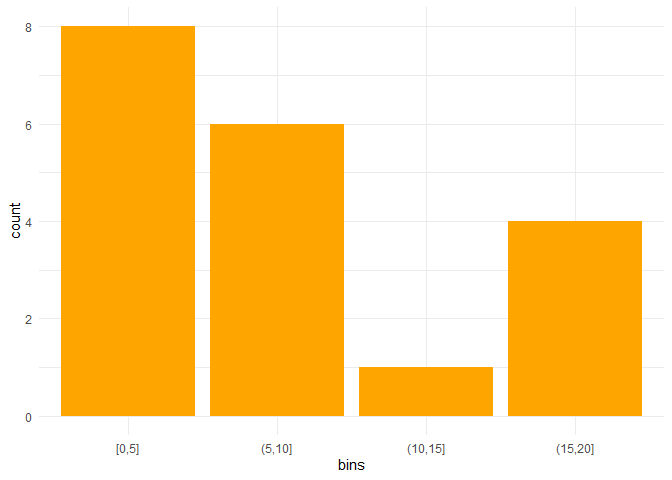
I have a data of student scores. I want to get the number of students who scored in particular marks intervals. Here in the sample data, the scores range from 1 to 20. I want to create an intervals of 0-5,6-10,11-15,16-20 (this interval can depend on the situation at hand). How can I do this?

library(tidyverse)

data<-tibble::tribble(
        ~score,
            6L,
           19L,
           10L,
            1L,
            9L,
            4L,
            6L,
            4L,
           20L,
            5L,
            6L,
           17L,
            4L,
            2L,
           17L,
            3L,
            9L,
           13L,
            1L
        )

ggplot(data,aes(score))+
  geom_bar(fill="orange")+
  theme_minimal()


Created on 2022-09-21 by the reprex package (v2.0.1)

You can use the cut() function to bin the data in the data frame. The cut() function has a labels argument that you can use if you do not like the default bin labels.

library(tidyverse)

data<-tibble::tribble(
  ~score,
  6L,
  19L,
  10L,
  1L,
  9L,
  4L,
  6L,
  4L,
  20L,
  5L,
  6L,
  17L,
  4L,
  2L,
  17L,
  3L,
  9L,
  13L,
  1L
)
data$bins <- cut(data$score,breaks = seq(0,20,5),include.lowest = TRUE)

ggplot(data,aes(bins))+
  geom_bar(fill="orange")+
  theme_minimal()

Created on 2022-09-21 with reprex v2.0.2

3 Likes

Thank you very much..

Regards,
Nithin

This topic was automatically closed 7 days after the last reply. New replies are no longer allowed.

If you have a query related to it or one of the replies, start a new topic and refer back with a link.