Bar chart with X axis divided by observations under same variable?

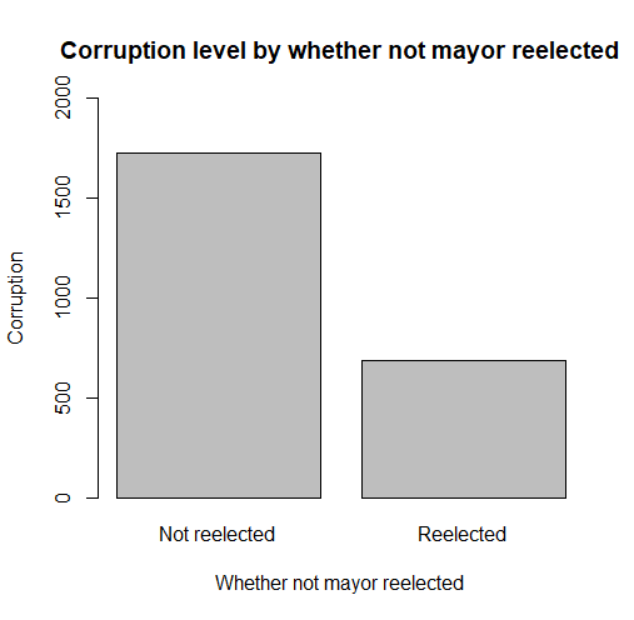
I've used the predict() function to estimate the value of the dependent variable, for two groups, with a few other conditions specified. I want to represent values for these two groups side-by-side in a graph and guess a bar chart is the best way to go:

barplot(brazil$reelected, brazil$corruption,
        names.arg = c("Not reelected", "Reelected"),
        main = "Corruption level by whether not mayor reelected",
        xlab = "Whether not mayor reelected",
        xlim = c(0,20),
        ylab = "Corruption")

brazil is the dataset name. I would like the Y axis to be the dependent variable (corruption) and the two bars to represent levels of corruption for two groups - one is 'not reelected' (or reelected == 0) and 'reelected' (or reelected == 1). When I run this, I get the error message:

Error in barplot.default(brazil$reelected, brazil$corruption, names.arg = c("Not reelected",  : 
  incorrect number of names

Any thoughts on how I go about this?

Thank you!

Can you supply a bit of sample data? A handy way to supply some sample data is the dput() function. In the case of a large dataset something like dput(head(mydata, 100)) should supply the data we need. Just do dput(mydata) where mydata is your data. Copy the output and paste it here.

This said that the number of arguments in names.arg()is different. Maybe more of 2 argument.
Is better help if you put a reproducible example.

My apologies, just learning about the forum - knowing how to ask for help feels essential here :smiley:

structure(list(municpality = c(1100122L, 1100502L, 1100809L, 
1101401L, 1101435L, 1101450L, 1200013L, 1200104L, 1200328L, 1200336L, 
1200708L, 1300060L, 1300300L, 1300607L, 1300680L, 1300805L, 1301001L, 
1301100L, 1301159L, 1301605L, 1301605L, 1302702L, 1302801L, 1302900L, 
1303007L, 1304062L, 1400027L, 1400159L, 1400209L, 1400407L, 1500107L, 
1500503L, 1500602L, 1500909L, 1501758L, 1502301L, 1502764L, 1502939L, 
1503044L, 1503200L, 1503408L, 1504059L, 1504422L, 1504950L, 1505205L, 
1505304L, 1505403L, 1505437L, 1505486L, 1505494L, 1505551L, 1505601L, 
1505650L, 1505700L, 1506559L, 1507409L, 1507474L, 1507706L, 1508126L, 
1600055L, 1600154L, 1600238L, 1600253L, 1600303L, 1600535L, 1600808L, 
1700350L, 1702000L, 1703701L, 1707009L, 1707108L, 1707553L, 1707652L, 
1708205L, 1708254L, 1709005L, 1709807L, 1712504L, 1712702L, 1713205L, 
1715705L, 1716109L, 1717909L, 1718006L, 1718709L, 1718907L, 1719004L, 
1720200L, 1720499L, 1721307L, 2100105L, 2100154L, 2100477L, 2101004L, 
2101202L, 2101251L, 2101806L, 2101939L, 2102309L, 2102358L), 
    corruption = c(0, 75, 40.0000005960464, 0, 66.6666686534882, 
    60.0000023841858, 0, 0, 0, 16.666667163372, 14.2857149243355, 
    0, 20.0000002980232, 0, 40.0000005960464, 0, 0, 66.6666686534882, 
    0, 16.666667163372, 0, 100, 0, 12.5, 12.5, 40.0000005960464, 
    0, 0, 40.0000005960464, 40.0000005960464, 66.6666686534882, 
    0, 0, 40.0000005960464, 50, 0, 75, 60.0000023841858, 0, 0, 
    20.0000002980232, 40.0000005960464, 60.0000023841858, 0, 
    20.0000002980232, 0, 40.0000005960464, 33.3333343267441, 
    40.0000005960464, 60.0000023841858, 25, 0, 20.0000002980232, 
    100, 50, 0, 0, 50, 60.0000023841858, 14.2857149243355, 0, 
    75, 33.3333343267441, 25, 41.6666656732559, 25, 0, 0, 0, 
    0, 0, 0, 0, 0, 20.0000002980232, 0, 20.0000002980232, 0, 
    0, 28.571429848671, 40.0000005960464, 0, 25, 20.0000002980232, 
    25, 50, 20.0000002980232, 50, 0, 0, 0, 0, 66.6666686534882, 
    40.0000005960464, 12.5, 37.5, 0, 66.6666686534882, 60.0000023841858, 
    50), council.age = c(1L, NA, 12L, 10L, 10L, 0L, 10L, 16L, 
    11L, 13L, 10L, 12L, 9L, 1L, 14L, 18L, 10L, 16L, 16L, 9L, 
    12L, NA, 10L, 5L, 7L, 28L, NA, 7L, 8L, NA, 11L, 14L, 13L, 
    11L, 11L, NA, 9L, 1L, 9L, 13L, 15L, 9L, 3L, 13L, 2L, 10L, 
    14L, 16L, 11L, 16L, 16L, 10L, 4L, NA, 15L, 13L, 12L, 17L, 
    10L, 9L, 8L, NA, 7L, 4L, 5L, 9L, 5L, 12L, 14L, 13L, 12L, 
    11L, 14L, 12L, 11L, 10L, 4L, 15L, 10L, 13L, 9L, NA, 13L, 
    14L, 7L, 16L, 10L, 13L, 13L, 6L, NA, NA, 8L, 9L, 12L, 7L, 
    12L, 8L, 14L, 12L), margin = c(19.6280002593994, 8.73600006103516, 
    15.0909996032715, 48.9500007629395, 3.13700008392334, 1.44099998474121, 
    18.0179996490479, 34.0699996948242, 15, 27.7140007019043, 
    2.22199988365173, 19.8540000915527, 14.6359996795654, 28.5799999237061, 
    10.0880002975464, 28.6000003814697, 2.53800010681152, 3.10400009155273, 
    7.60400009155273, 0.550000011920929, 7.17999982833862, 5.5479998588562, 
    4.04899978637695, 15.0340003967285, 2.76799988746643, 3.3199999332428, 
    2.0699999332428, 7.22100019454956, 2.34299993515015, 2.375, 
    0.778999984264374, 22.2280006408691, 12.7959995269775, 0.800000011920929, 
    2.32399988174438, 10.3170003890991, 15.9370002746582, 2.43700003623962, 
    23.5109996795654, 6.07200002670288, 22.1399993896484, 37.6940002441406, 
    11.8050003051758, 8.11999988555908, 10.0159997940063, 18.5219993591309, 
    0.603999972343445, 17.1009998321533, 10.0530004501343, 15.5200004577637, 
    57.2400016784668, 8.10599994659424, 4.7979998588562, 7.32000017166138, 
    0.620000004768372, 25.8020000457764, 10.4099998474121, 43.148998260498, 
    7.41099977493286, 3.78699994087219, 2.03999996185303, 15.0500001907349, 
    7.3600001335144, 12.4910001754761, 18.8999996185303, 14.5459995269775, 
    0.708000004291534, 6.84800004959106, 7.36399984359741, 8.45800018310547, 
    11.6579999923706, 16.193000793457, 26.42799949646, 3.03699994087219, 
    21.0939998626709, 0.509999990463257, 11.5819997787476, 43.439998626709, 
    1.76999998092651, 11.1169996261597, 19.6240005493164, 1.90799999237061, 
    6.69299983978271, 8.37399959564209, 6.88600015640259, 6.80000019073486, 
    21.1979999542236, 8.45800018310547, 8.58199977874756, 26.9799995422363, 
    16.6989994049072, 15.4130001068115, 10.4099998474121, 39.0089988708496, 
    4.48799991607666, 1.51800000667572, 7.40000009536743, 11.5860004425049, 
    13.7419996261597, 32.9599990844727), reelected = c(0L, 0L, 
    0L, 1L, 0L, 1L, 0L, 1L, 0L, 0L, 0L, 1L, 1L, 1L, 0L, 1L, 0L, 
    0L, 1L, 0L, 0L, 0L, 0L, 1L, 1L, 0L, 0L, 0L, 0L, 0L, 0L, 0L, 
    0L, 1L, 0L, 0L, 0L, 1L, 0L, 0L, 1L, 1L, 1L, 0L, 1L, 0L, 0L, 
    0L, 0L, 0L, 0L, 0L, 0L, 0L, 1L, 0L, 1L, 0L, 1L, 0L, 0L, 0L, 
    0L, 1L, 1L, 0L, 0L, 0L, 0L, 0L, 0L, 0L, 0L, 0L, 0L, 0L, 0L, 
    0L, 0L, 0L, 0L, 0L, 0L, 1L, 0L, 0L, 1L, 0L, 1L, 0L, 1L, 0L, 
    0L, 1L, 0L, 1L, 0L, 0L, 0L, 1L), transfers = c(75.2600014209747, 
    28.3100008964539, 36.039999127388, 72.2400009632111, 31.9000005722046, 
    23.3799979090691, 26.2800008058548, 50.4000008106232, 64.0599966049194, 
    57.2899997234344, 45.1200008392334, 39.2700016498566, 60.2400004863739, 
    55.1400005817413, 42.7100002765656, 62.6399993896484, 36.9100004434586, 
    49.7199982404709, 44.2499965429306, 57.150000333786, 54.150003194809, 
    72.4200010299683, 26.3400018215179, 50.67999958992, 28.8800001144409, 
    NA, 57.8399956226349, 44.1299974918365, 34.9400013685226, 
    63.9800012111664, 75.1900017261505, NA, 39.8399978876114, 
    57.9499959945679, 30.8599978685379, NA, 21.6999992728233, 
    NA, 47.0899999141693, 57.5100004673004, 47.4900007247925, 
    42.4100011587143, 85.3399991989136, 52.8599977493286, 38.1500005722046, 
    22.2299993038177, 65.8399939537048, 52.6199996471405, 39.3799990415573, 
    51.4200031757355, 63.3499979972839, 50.2399981021881, NA, 
    54.610002040863, 58.050000667572, 60.0400030612946, 24.0400016307831, 
    33.9100003242493, 25.2400010824203, 41.7899996042252, 47.7799952030182, 
    47.9699969291687, 34.5299988985062, 44.3599998950958, 71.4600026607513, 
    40.26999771595, 42.7900016307831, 37.279999256134, 29.449999332428, 
    49.0199983119965, 52.8699994087219, 22.4199995398521, 18.9900010824203, 
    45.2399998903275, 30.0999999046326, 55.5899977684021, 26.6300022602081, 
    35.5100005865097, 16.5800005197525, 52.9399991035461, 30.9200018644333, 
    49.7100025415421, 56.5900027751923, 38.850000500679, 17.2299981117249, 
    44.7899997234344, 42.6899999380112, 59.3800008296967, 34.850001335144, 
    24.5900005102158, 25.7999986410141, 52.0099997520447, 56.1299979686737, 
    NA, 79.9700021743774, 49.549999833107, 37.0399981737137, 
    46.629998087883, 51.1300027370453, 63.5600030422211), poverty = c(26.9950008392334, 
    43.1689987182617, 49.4099998474121, 38.2210006713867, 52.2599983215332, 
    60.7270011901855, 55.1590003967285, 54.4970016479492, 91.5419998168945, 
    66.0400009155273, 56.8959999084473, 79.6380004882812, 74.8199996948242, 
    75.9130020141602, 81.9759979248047, 80.7740020751953, 80.3629989624023, 
    60.3880004882812, 72.6829986572266, 86.9700012207031, 86.9700012207031, 
    74.9359970092773, 84.5240020751953, 73.7809982299805, 75.8730010986328, 
    55.9700012207031, 65.9879989624023, 62.9189987182617, 48.048999786377, 
    78.8369979858398, 64.693000793457, 49.6599998474121, 37.6609992980957, 
    76.9680023193359, 60.1910018920898, 74.8980026245117, 38.3440017700195, 
    58.5069999694824, 62.8639984130859, 62.8460006713867, 64.9739990234375, 
    58.7900009155273, 49.1380004882812, 72.8619995117188, 80.0090026855469, 
    57.3359985351562, 70.2160034179688, 51.3629989624023, 69.1179962158203, 
    65.9089965820312, 63.2949981689453, 68.5189971923828, 52.109001159668, 
    71.7699966430664, 78.0080032348633, 62.4539985656738, 73.7850036621094, 
    71.0869979858398, 49.8839988708496, 55.8499984741211, 68.6100006103516, 
    62.4819984436035, 72.6309967041016, 35.4049987792969, 52.3460006713867, 
    57.5309982299805, 54.7729988098145, 39.132999420166, 64.5530014038086, 
    51.0449981689453, 55.5369987487793, 55.2869987487793, 48.0589981079102, 
    50.7999992370605, 58.4169998168945, 82.7050018310547, 67.8740005493164, 
    46.7060012817383, 80.8040008544922, 39.75, 73.2460021972656, 
    34.2179985046387, 66.9619979858398, 71.0869979858398, 58.2220001220703, 
    71.9029998779297, 71.745002746582, 78.0749969482422, 59.4210014343262, 
    71.3150024414062, 82.7480010986328, 84.6940002441406, 81.0970001220703, 
    65.7129974365234, 65.2669982910156, 78.1869964599609, 75.3130035400391, 
    74.0550003051758, 81.2919998168945, 82.4000015258789)), row.names = c(NA, 
100L), class = "data.frame")

It can help. It gets easier after the first 50 years.

Here are a couple of useful sources: Minimal Reproducible Example and Tips for writing questions.

I am not sure that I understand what you want but I reduced the data set to a 4 X 3 table and plotted that.

dat3 structure(list(status = c("No", "No", "Yes", "Yes"), corrupt = c("No", 
"Yes", "No", "Yes"), N = c(33L, 39L, 9L, 19L)), row.names = c(NA, 
4L), class = "data.frame")

Isla1

However I did this using the data.table package which is just a bit different than most of the rest of R so my code may [will?] look very weird to you. If I am on the right track, I can translate the code into standard and/or tidyverse code or leave you to explore data.table which has some very interesting features.

I named your original sample data set dat1

# read in data as data.frame called "dat1"

library(ggplot2)
library(data.table)

setDT(dat1) # convert to data.table. 

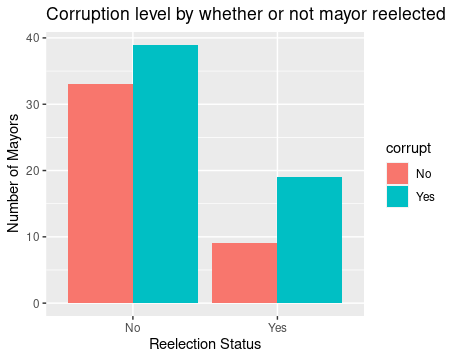
# Create two new binary variables based on "reelected" & "corruption" variables
dat1[ , status := fifelse( reelected == 1, "Yes", "No")]
dat1[ , corrupt := fifelse(corruption == 0, "No", "Yes")]

 # This can be done as one step
dat2  <- dat1[, .(status, corrupt)]
dat3  <- dat2[, .N, by = .(status, corrupt)]

## plot
ggplot(dat3, aes(status, N, fill = corrupt)) + geom_bar(stat = "identity", position=position_dodge()) +
  ggtitle( "Corruption level by whether or not mayor reelected") + xlab("Reelection Status") +
  ylab("Number of Mayors")

1 Like

I am simply assuming that corruption is some quantity that you desire to sum up for each group (0/1)

I believe in base R, one would do :

(braz_smry <- aggregate(corruption ~ reelected,
                        data=brazil,
                        FUN = sum))

barplot(height = braz_smry$corruption,
        names.arg = c("Not reelected", "Reelected"),
        main = "Corruption level by whether not mayor reelected",
        xlab = "Whether not mayor reelected",
        ylab = "Corruption",
        ylim=c(0,2000))

This topic was automatically closed 42 days after the last reply. New replies are no longer allowed.

If you have a query related to it or one of the replies, start a new topic and refer back with a link.