I think that ggplot and leaflet will handle most of your needs.
A honorable mention goes to tmap package - GitHub - mtennekes/tmap: R package for thematic maps. It introduces yet another map making syntax, and produces decent maps with very little tweaking. It supports both static and dynamic output. But competing against ggplot in static maps is hard, and in dynamic mapping using leaflet directly gives you more control. If you are familiar with ggplot syntax I would leave it out.
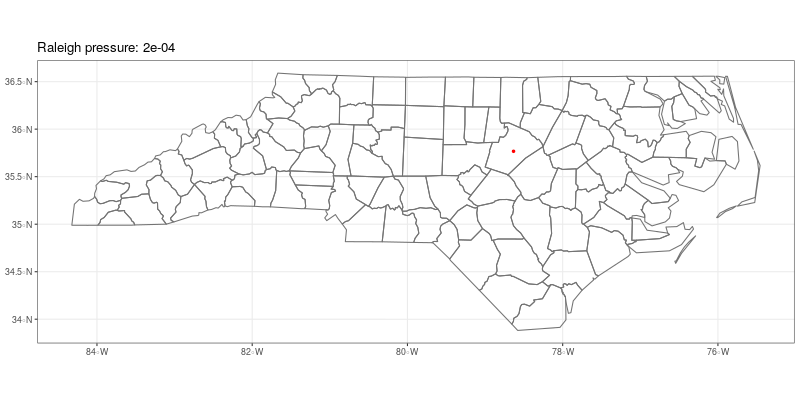
And as my curiosity got the better of me I propose a workflow for animated maps, built on ggplot and gganimate. The hardest part was faking the data to be animated; at the end I ended up recycling the well known & loved pressure dataset.
library(sf)
library(gganimate)
library(tidyverse)

# NC counties - a shapefile shipped with the sf package
shape <- sf::st_read(system.file("shape/nc.shp",
                                 package ="sf"))

# one city - let recycling multiply the name & coordinates
points <- data.frame(name = c("Raleigh"),
                     x = c(-78.633333),
                     y = c(35.766667),
                     value = pressure$pressure)

# a plot - with a few extras :)
obrazek <- ggplot(data = points) +
  geom_point(aes(x = x, y = y, size = value), col = "red") + # the points
  geom_sf(data = shape, col = "grey45", fill = NA) + # the counties
  theme_bw() +
  theme(axis.title = element_blank()) +
  guides(size = F) +
  labs(title = 'Raleigh pressure: {closest_state}') +
  gganimate::transition_states(value,
                               transition_length = 1,
                               state_length = 2) +
  gganimate::ease_aes('sine-in-out')

# create animation
gganimate::animate(obrazek, nframes = 2*(nrow(points)+1),
                   height = 400, width = 800, fps = 10,
                   renderer = gifski_renderer(loop = T))

# save animation
gganimate::anim_save('animated_map.gif')