I have a peculiar problem, and writing here after many workarounds and still not making perfect multi-panel figures in svg or pdf format. Before assembly into muti-panel figures, the plots look fine.
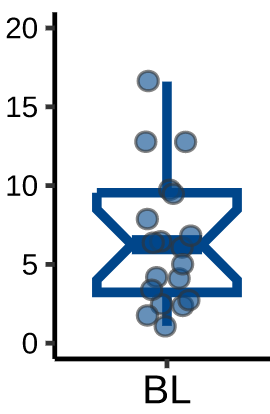
Once assembled, the individual plots have a slight off-set of the top side of the box plot to the right. It looks like an indentation int the top left corner:
I am able to save ggplot2 box plots as svgs that look fine and close to png format. Once I import them back for assembly (workaround, since I need to combine figs from multiple sources) i have to do it as grobs with grImport2 package like so:
# Loop through the SVG files and read them into the list as grobs
for (i in 1:length(svg_files)) {
  svg_plot <- readLines(svg_files[i])
  pic <- grImport2::readPicture(file = svg_plot)
  grob <- grImport2::pictureGrob(pic)
  plots[[i]] <- grob
}
To save these plots prior to importing I have to use Cairo, otherwise I can not assemble into multi-panel like so:
# Save plot as SVG
ggsave("box_plot.svg", plot = p2, width = 3, height = 1.8, device = CairoSVG)
The assembly does not seem to be affecting this, as I have used Cowplot or gridExtra, and Cairo or svg, or pdf device with the same results. Here is the example code for saving final output:
svg(file = "Fig1_multiplot_panel.svg", width = 10, height = 11)
# Combine the plots into a single figure
combined_plot <- plot_grid(plotlist = plots, ncol = 3, align = "h", axis = "tb", labels = NULL)
combined_plot
dev.off()
Hi @Andrius
I can reproduce your problem with the following reprex (see below).
It seems like a bug in the grImport2 package.
You stated you wanted to combine plots some of which were sourced from elsewhere (not R?). This could also be a problem as the help for readPicture says
It is very unlikely that an SVG file that was NOT generated by Cairo will import properly.
This function may read the file without error, but the render (via grid.picture) is very
unlikely to faithfully reproduce the original image.
#----- reprex -----
library(ggplot2)
library(Cairo)
library(grImport2)
library(cowplot)
iris_new <- iris[iris$Species %in% "setosa",]
p1 <- ggplot(iris_new) +
aes(x=Species, y=Sepal.Length) +
geom_boxplot(notch=FALSE)
p2 <- ggplot(iris_new) +
aes(x=Species, y=Sepal.Width) +
geom_boxplot(notch=TRUE)
# Save plots as SVG files
ggsave("p1.svg", plot = p1, width = 3, height = 1.8, device = CairoSVG)
ggsave("p2.svg", plot = p2, width = 3, height = 1.8, device = CairoSVG)
svg_files <- list.files(pattern=".svg")
# Loop through the SVG files and read them into the list as grobs
plots <- list(length = length(svg_files))
for (i in 1:length(svg_files)) {
svg_plot <- readLines(svg_files[i])
pic <- grImport2::readPicture(file = svg_plot)
grob <- grImport2::pictureGrob(pic)
plots[[i]] <- grob
}
# Combine the plots into a single figure
svg(file = "Fig1_multiplot_panel.svg", width = 10, height = 11)
combined_plot <- plot_grid(plotlist = plots, ncol = 3, align = "h", axis = "tb", labels = NULL)
combined_plot
dev.off()
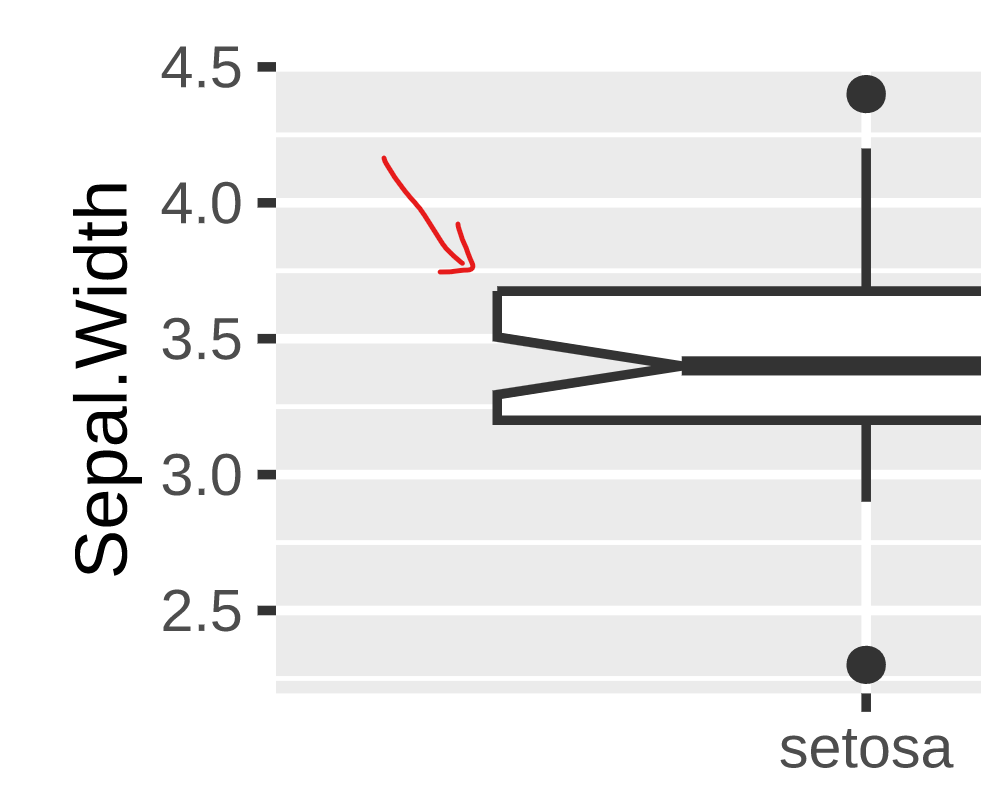
# Examine the combined plot in your browser - artifacts in top-left corner of box are visible
Thank you so much for the reprex! Yes, it does reproduce the problem exactly.
Although it is not as visible as in mine, the upper left corner is not completely connected as it should be:
The svgs are generated by Cairo, in R, just from other datasets/analyses, so that is not a problem.
Now I just need to see if there are some settings grImport2::readPicture or grImport2::pictureGrob that may fix this... or yet another work around.
I could not solve it with svg import, so, I had to reproduce the plots, add them to the list, convert to grobs and then assemble to multipanel figure.
I reported this bug to the package "grImport2" maintainer/creator.
This works as a workaround:
# Add all your plots to a list,  asign to variable "plots"

library(grid)

# Convert plot list to grobs for better display of graphics
grobs <- lapply(plots, ggplotGrob)

# Combine grobs into a single plot
combined_plot <- plot_grid(plotlist = grobs, ncol = 3, align = "h", axis = "tb", labels = NULL)

# Save plot as SVG
svg(file = "Fig1_multiplot_panel.svg", width = 10, height = 11)
grid.draw(combined_plot)
invisible(dev.off())