Calculate P-values for multiple columns of two products

I want to create a column with p-values in order to compare every columns (biomarkers) for the two diets(NND (n= 91) and ADD (n= 56)), but i don't know how to do it.

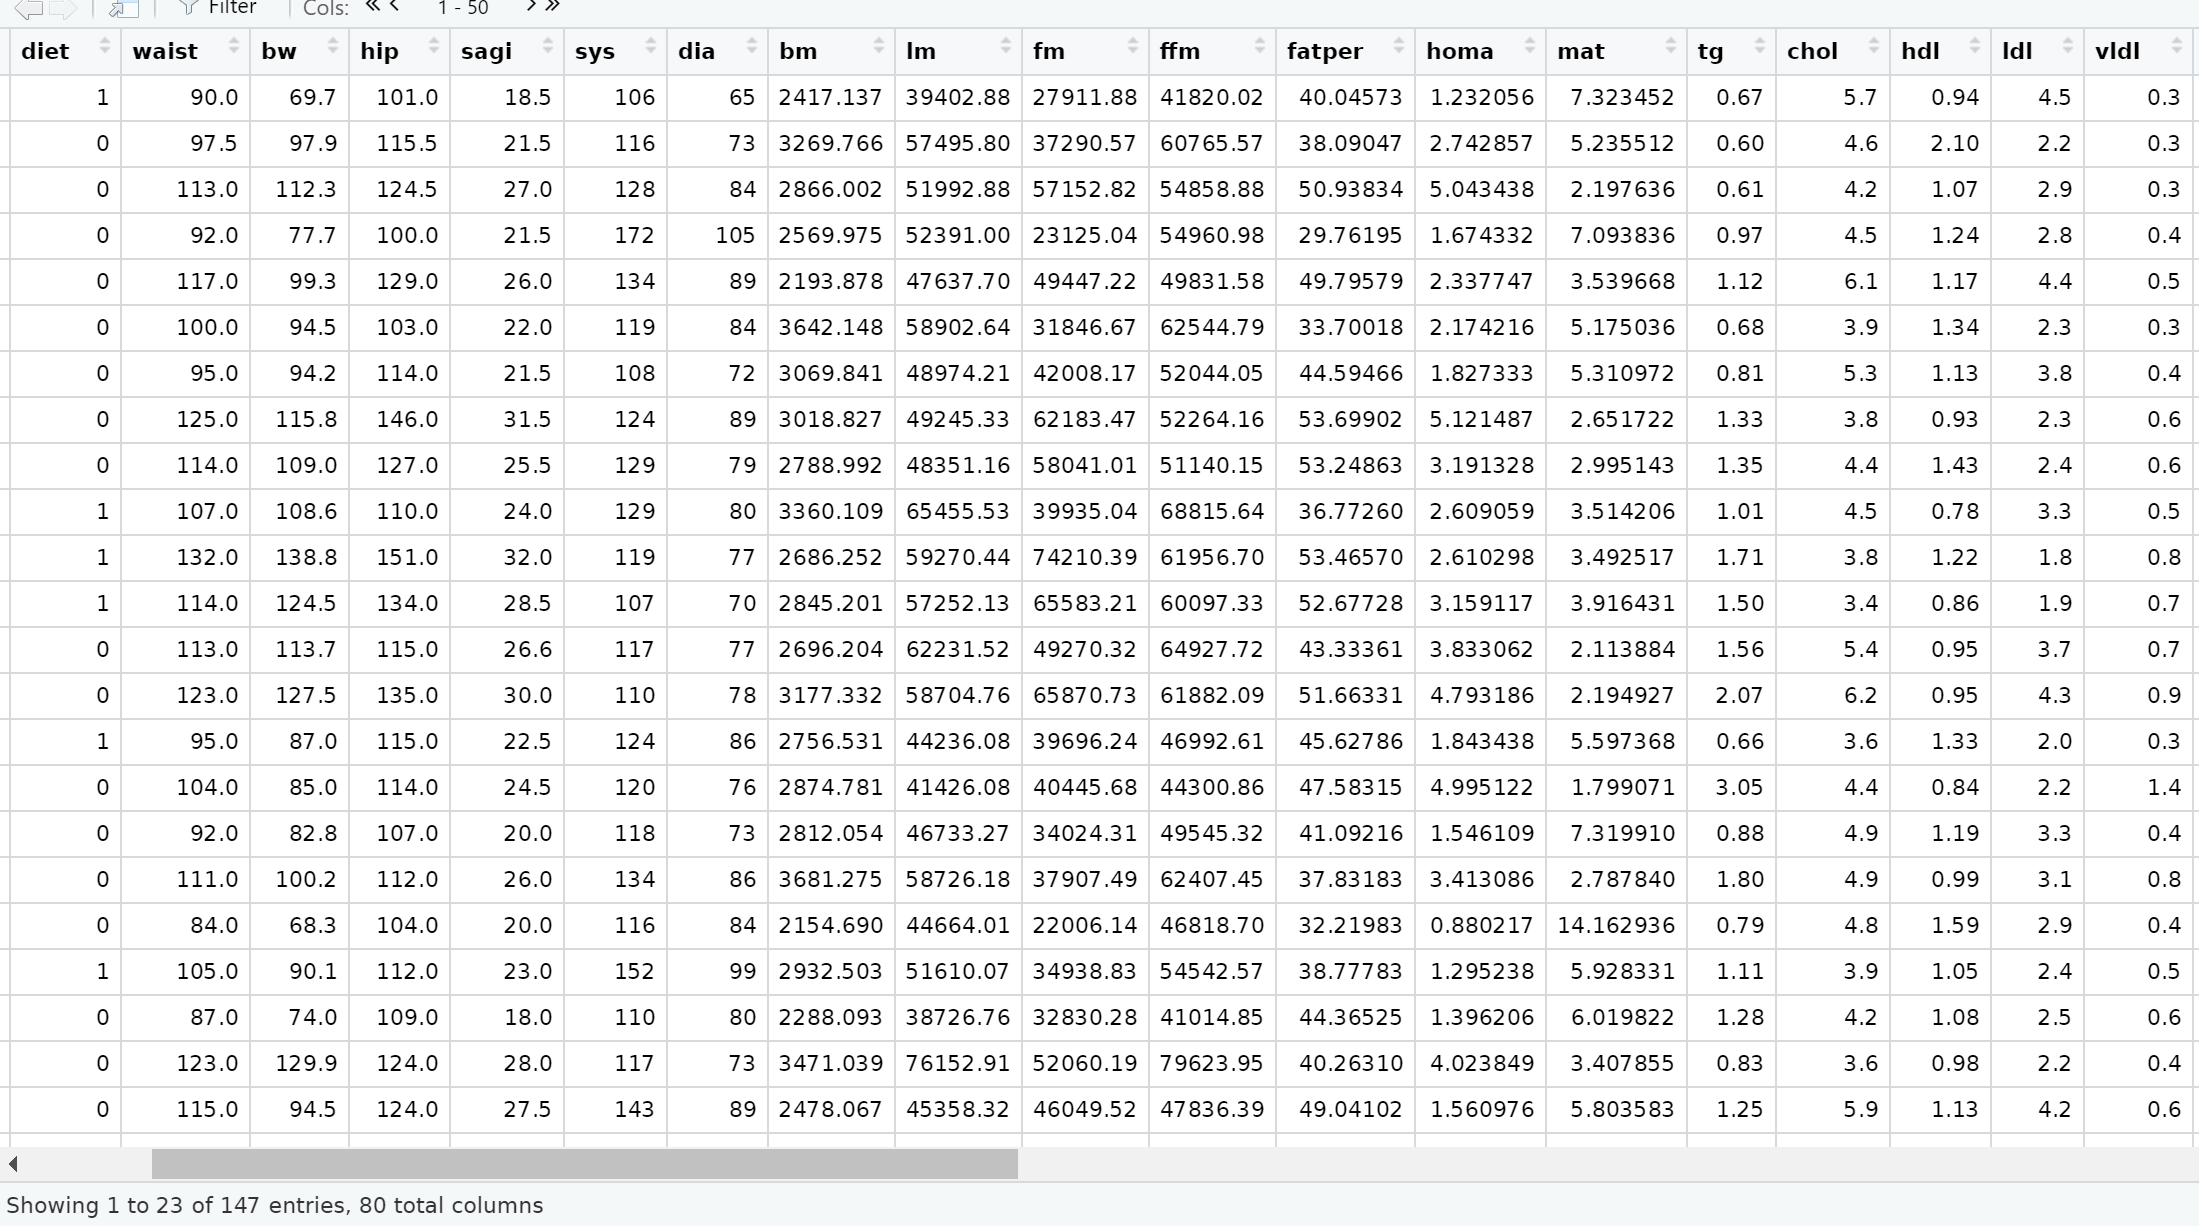
Screenshot of the data called NordicDiet_baseline:

Data as pdf:
nordicdiet.pdf (2.6 MB)

I have used the following code to filter out NND (diet = 0) and ADD (diet = 1) and calculated means and sd for every column but I don't know if that's even relavent to my question:

NordicDiet_baseline <- NordicDiet_raw %>% 
  filter(visit=="3")
NordicDiet <- NordicDiet_baseline[, 4:22]

NND_subset <- NordicDiet %>% 
  filter(diet=="0")
NND <- na.omit(NND_subset[,2:19])

ADD_subset <- NordicDiet %>% 
  filter(diet=="1")
ADD <- na.omit(ADD_subset[,2:19])

colMeans(NND)
colMeans(ADD)

NND %>% summarise_if(is.numeric, sd)
ADD %>% summarise_if(is.numeric, sd)

This isn't so much a how problem as a what problem. What is it that we want to know about the results reported here? Differences between diet with respect to BMI? Between sex and waist? Do we want to know whether any or all of these variables reflect changes with respect to visit? Whether any two variables have different means or medians?

We probably don't need to do anything to do in order to know that BMI is correlated with weight and height—it should be perfectly correlated because that's how it's defined. (Although that might be a check on data integrity.)

I want to make a new column with the p value between every biomarkers for ADD (diet = 1) and NND (diet = 0) diet for instance weight ADD and NND, hip ADD and NND... vldl ADD and NND and so on - i just wondered if the was a way to do this for everyone at once instead of doing a t.test for every single biomarkers

Here is one possible method.

library(purrr)
library(dplyr)
#Invent data
set.seed(123)
DF <- data.frame(diet=sample(0:1,100,replace = TRUE,prob = c(.6,.4)),
                 wt=runif(100,min = 50,max = 100),
                 ht=runif(100,min = 1.4,max = 2.1),
                 sys=rnorm(100,110,10))

#Split data by diet
Diet0 <- DF |> filter(diet==0) |> select(-diet)
Diet1 <- DF |> filter(diet==1) |> select(-diet)

#Iterate over the data frames
map2_dbl(Diet0,Diet1,~t.test(.x,.y)$p.value)
#>        wt        ht       sys 
#> 0.8967498 0.2830181 0.1845716

#Compare to manual result
t.test(Diet0$wt,Diet1$wt)$p.value
#> [1] 0.8967498
t.test(Diet0$ht,Diet1$ht)$p.value
#> [1] 0.2830181
t.test(Diet0$sys,Diet1$sys)$p.value
#> [1] 0.1845716

Created on 2022-10-26 with reprex v2.0.2

This topic was automatically closed 42 days after the last reply. New replies are no longer allowed.

If you have a query related to it or one of the replies, start a new topic and refer back with a link.