Hey all,
I am trying to run some partial correlations using the 'pcor.test' function, to understand the association between some variables and the distance one travels, controlling for age and gender.
for (i in names){
  output <- pcor.test(correcteddf[,i],correcteddf$distance,list(correcteddf$age,correcteddf$gender),method = c("pearson"))
  correlation = output[1,1]
  listcorr[j] = correlation
  pvalue = output[1,2]
  listp[j] = pvalue
  j = j + 1
}
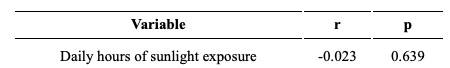
I have printed the outputs into a table:
However, I would like to print out the confidence intervals that are associated with these r values for this too and haven't been able to find a way to do this.
I would be grateful for a helping hand!