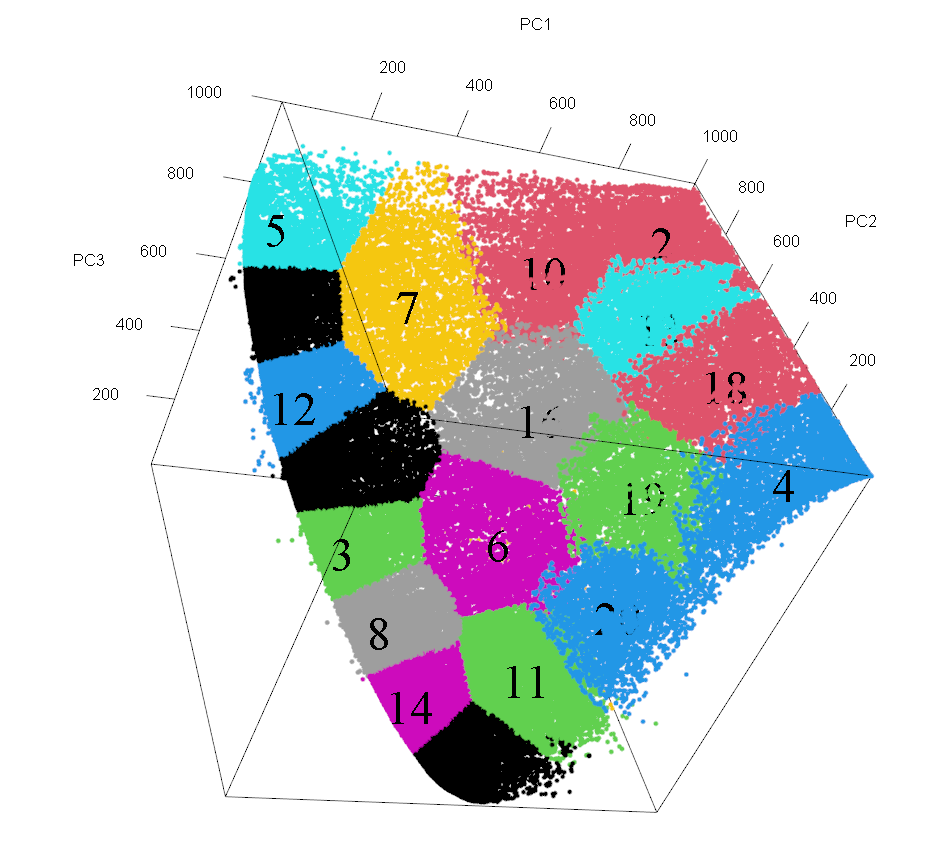
But as you can see in case of 2 and 10(red) and 4 and 20(blue), some different and neighbored categories are marked with same color so that their data might be looked as same category. Plus, the black ones do not show the category number well. So I wanna solve these two problems.
I can use both 'scatterplot3d' and 'plot3d' functions for plotting 3 dimensional data(in example, plot3d was used). I distinguished the color by elements designate colors that each function provides, but have no idea how to customize with my requirements. At first ggplot2 seemed to be a solution, but it is for 2d plotting. So to wrap up, my questions are these :
What should I do to make every category/cluster has a unique color in 3d plot? Is there any command that giving different colors for all categories?
To prevent the letter is being screened by colors, I would exclusive dark color. What should I do to include only certain colors that I want?