I am using two packages, 'scatterplot3d''s 'scatterplot3d' function and 'rgl''s 'plot3d' function to visualize 3 dimensional dataset.
I've done a clustering analysis, and want to markdown each center point of clusters to the graph.
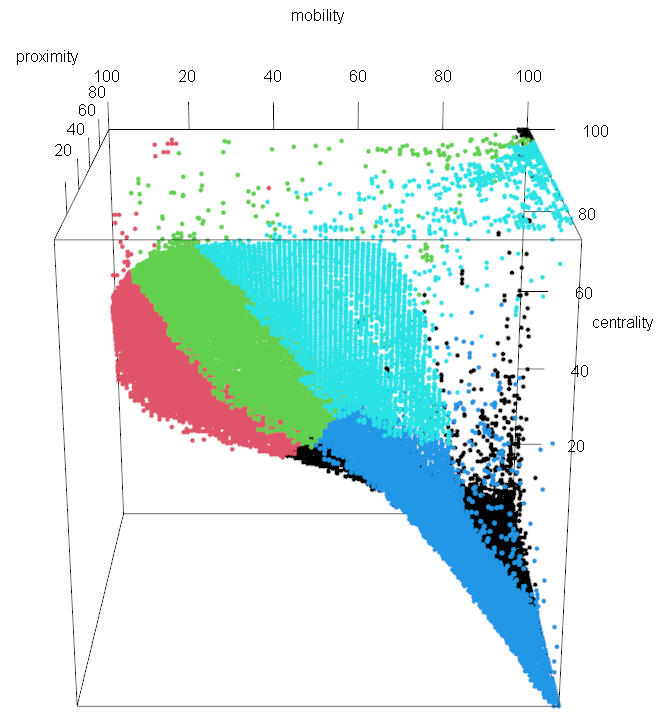
First of all, maximum length of each sides of 3d plot is 100, as you can see(following is plot3d version)
The following is the data that contains the coordinates of centers of each cluster, whose name is 'kmeans_1$centers'.
  mobility proximity centrality
1   80.037    76.545     17.211
2   14.767    82.608     48.853
3   29.133    48.644     70.497
4   78.005    28.132     28.382
5   50.950    17.280     85.630
Thus, I want to mark '1' at point of (mobility = 80.037, proximity = 76.545, centrality = 17.211), and same as 2/3/4/5. What I want to do is it is very unconvenient to match which cluster ID is for which color of cluster in graph.
There are tons of materials I can refer in terms of 2d plot(using 'text' function), but weirdly none about 3d plot...Please help me.