I can not reproduce your code without your data, so just a general comment: consider switching your code from using package tmap to utilizing leaflet library directly (meaning via the leaflet package). Leaflet plays nicely with Shiny and there is even a tutorial by RStudio https://rstudio.github.io/leaflet/shiny.html
It can handle the polygons from Natural Earth easily, and leaflet::addCircleMarkers() is functionally equivalent to tmap::tm_bubbles().
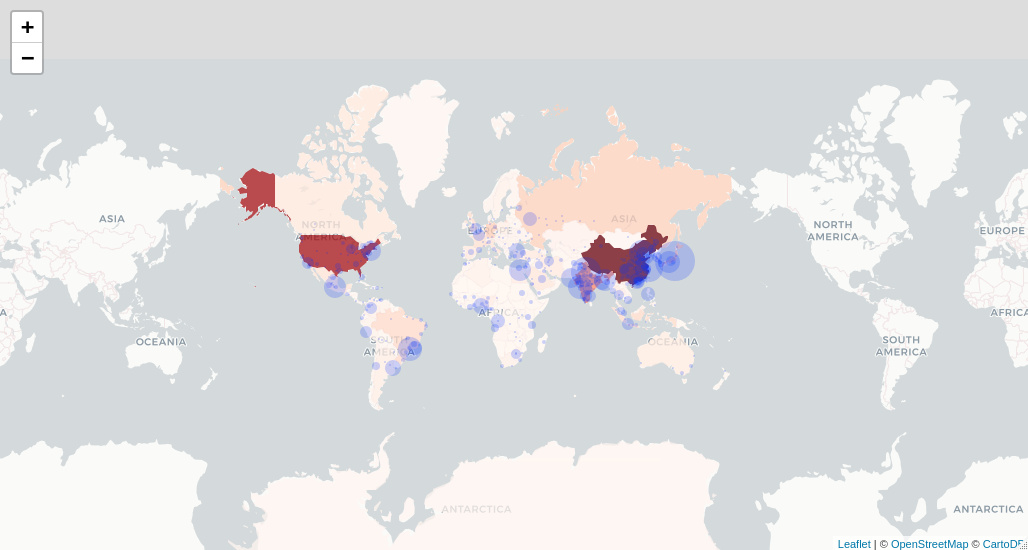
To illustrate my point consider this mock code - built on Natural Earth polygons (we seem to be using the same, it is a good piece of data:) and Metro dataset from the tmap package.
For the sake of clarity I have omitted the shiny part.
library(tidyverse)
library(leaflet)
library(tmap) # for the Metro dataset
library(sf)

data("metro") # from tmap

metro <- metro %>%
  select(pop = pop2020) %>%
  mutate(pop = pop / max(pop)) # normalise the values

mapa <- st_read("./data/maps/ne_50m_admin_0_countries.shp") # replace with your path :)

pal <- colorNumeric(palette = "Reds",  domain = mapa$GDP_MD_EST)

leaflet() %>%
  addProviderTiles(providers$CartoDB.Positron) %>%
  setView(lng = 14.46, lat = 50.07, zoom = 1) %>%
  addPolygons(data = mapa,
              fillColor = ~pal(mapa$GDP_MD_EST),
              fillOpacity = 0.75,
              stroke = F) %>%
  addCircleMarkers(data = metro,
                   radius = 20 * metro$pop,
                   stroke = F)