Hi I am learning how to use ggplot2 and I find these results a bit confusing .
Example 1:
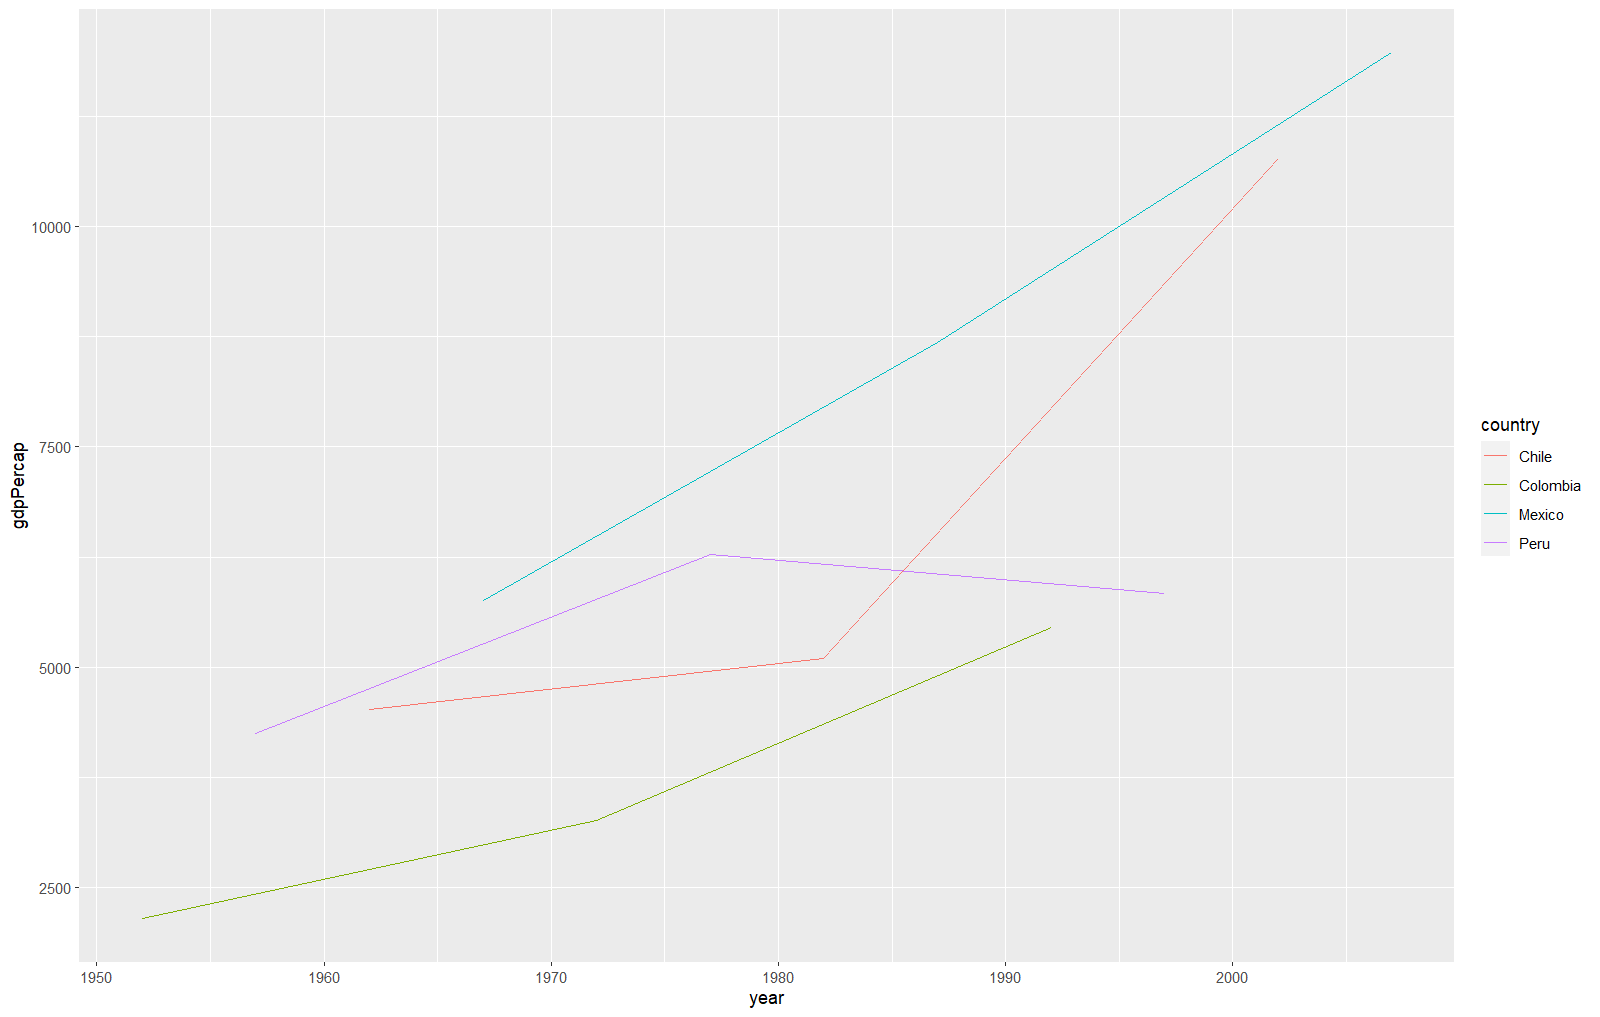
  filter(country ==  c("Colombia", "Peru", "Chile", "Mexico")) %>%
  ggplot( aes(x = year, y =gdpPercap, color = country)) +
  geom_line()
I get this graph and it is wrong
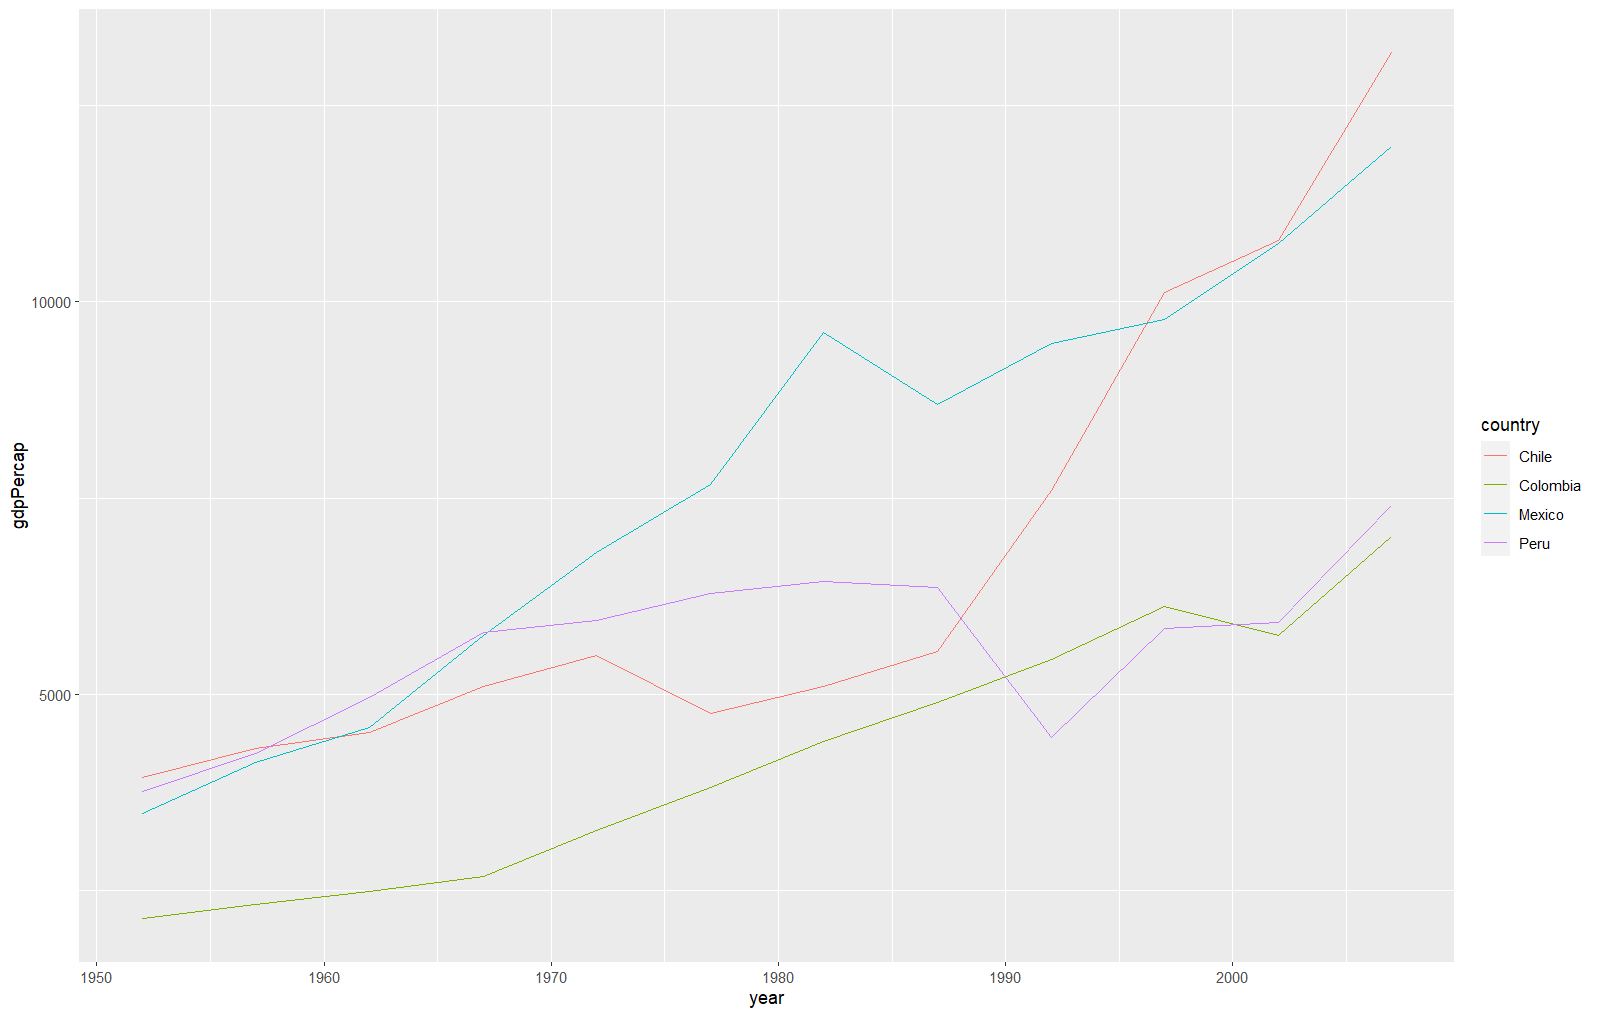
Example2 & 3 (both correct):
gapminder %>%
  filter(country %in% c("Colombia", "Peru", "Chile", "Mexico"))%>%
  ggplot( aes(x = year, y =gdpPercap, color = country)) +
  geom_line()

gapminder %>%
  filter(country == "Colombia" | country == "Peru" | country == "Chile" | country == "Mexico")%>%
  ggplot( aes(x = year, y =gdpPercap, color = country)) +
  geom_line()
Don't understand why with example one I don´t get the same result than with examples 2 and 3. Why filter(country == c("Colombia", "Peru", "Chile", "Mexico")) doesn't work? And what it is doing?