I'm trying to fit a model using C5.0. My code is the following:
set.seed(123)
library(C50)
library(caret)
control <- trainControl(method = "repeatedcv", number = 10, repeats = 3)
fit_train <- train(vowel ~ F1 + F2 + F3 + duration, data = train, method = "C5.0", trControl = control)
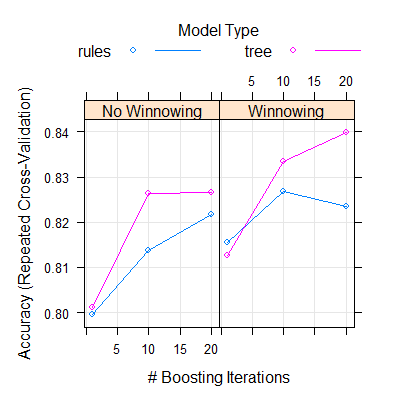
plot(fit_train)
The problem is that I want to plot the tree, but instead of that, I get a plot of boosting iterations when I use the plot() function (see the figure below).
No, I get this error: Error in data.frame(eval(parse(text = paste(obj$call)[xspot])), eval(parse(text = paste(obj$call)[yspot])), : arguments imply differing number of rows: 880, 220, 0
something seems wrong with the caret C50 integration ...
I think you can try an approach of getting the parameters of the best fits from the caret return, and then use that to fit a standalone c50model.
c5model <- C5.0(vowel ~ F1 + F2 + F3 + duration,
                       data = train,
                       trials = fit_train$bestTune$trials,
                       rules = FALSE,
                       control = C5.0Control(winnow = fit_train$bestTune$winnow))
plot(c5model)