What I want to do is not adjusting the scale, but just the size of text of the gradation.
I searched about it, but there was nothing helpful. There are tons of things that telling how to adjust the text size of labels and subtitles or to adjust the scale size, but useless to me.
So someone tell me how to do that please...
If it isn't able to be done with ggplot2, other functions are OK.
I am not sure what you mean by the "text size of the gradation". If you mean the legend, the code below shows how to adjust that text size. The first plot shows the standard text and the second shows a smaller text.
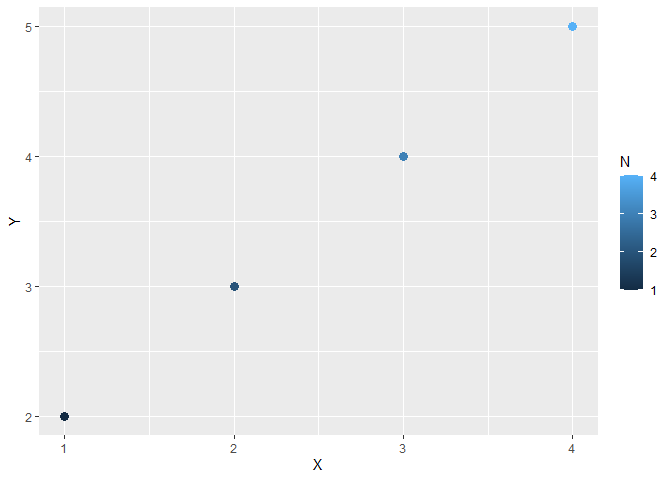
library(ggplot2)
DF <- data.frame(X=1:4,Y=2:5,N=1:4)
ggplot(DF,aes(X,Y,color=N))+geom_point(size=3)
ggplot(DF,aes(X,Y,color=N))+geom_point(size=3)+
  theme(legend.text = element_text(size=6))

Created on 2022-09-04 with reprex v2.0.2
Thank you so much! But I didn't mean the legend.
To express with the graph you gave,
what I was intending is the numbers(like 1, 2, 3...) on the x axis and y axis in that graph. But most of materials tell how to adjuste the interval of them, not the size of them.
Others tell how to adjust the size of text like "X" under the graph and "Y" on the left.
What I am asking this is, when I increased the text size(of axis label), the number size(on the axis) didn't increase and in conclusion, this decreases visibility of gradation(numbers on the axis I mean..).
Use axis.text.x, axis.text.y or axis.text for both simultaneously. You can change those by specifying them in theme() like
Myggplot +
  theme(axis.text = element_text(size = 20))
See here (ggplot2 axis ticks : A guide to customize tick marks and labels - Easy Guides - Wiki - STHDA) for some examples
Kind regards
This topic was automatically closed 7 days after the last reply. New replies are no longer allowed.
If you have a query related to it or one of the replies, start a new topic and refer back with a link.