JeffF
January 1, 2023, 1:42pm
1
This dataframe union_current_fraction contains these two columns
CC18_308a approval_fraction
  <fct>                 <dbl>
   1                    0.0219
   2                    0.0391
   3                    0.0276
   4                    0.184
I have tried various versions of this
ggplot(union_current_fraction) +
to no avail. I get four columns but they are all of the same height.
Thanks,
Welcome to the community @JeffF ! The reason the columns are all the same height is because sum() is returning the sum of all rows for each line item, as illustrated in the data frame below.
library(tidyverse)

union_current_fraction = data.frame(
  CC18_308a = factor(c(1, 2, 3, 4)),
  approval_fraction = c(.0219, .0391, .0276, .184)
) %>%
  mutate(y = sum(approval_fraction))

union_current_fraction
#>   CC18_308a approval_fraction      y
#> 1         1            0.0219 0.2726
#> 2         2            0.0391 0.2726
#> 3         3            0.0276 0.2726
#> 4         4            0.1840 0.2726
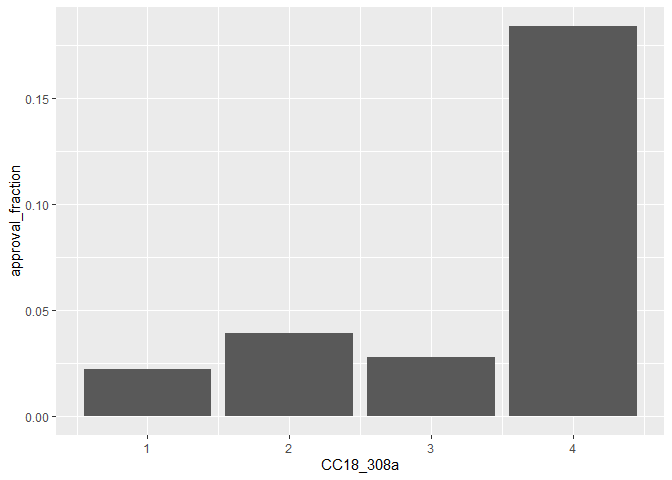
For the plot, do you want to drop sum() and just plot approval_fraction ?
ggplot(union_current_fraction) +
  geom_col(aes(x=CC18_308a, y=approval_fraction))
Created on 2023-01-01 with reprex v2.0.2.9000
FJCC
January 1, 2023, 2:16pm
3
If you just want the four values plotted there is no need to use the sum() function.
union_current_fraction <- data.frame(CC18_308a= 1:4,
                                     approval_fraction = c(.0219,.0391,.0276,.184))


library(ggplot2)
ggplot(union_current_fraction) +
  geom_col(aes(x=CC18_308a, y=approval_fraction ))
Created on 2023-01-01 with reprex v2.0.2
system
January 8, 2023, 2:17pm
4
This topic was automatically closed 7 days after the last reply. New replies are no longer allowed.