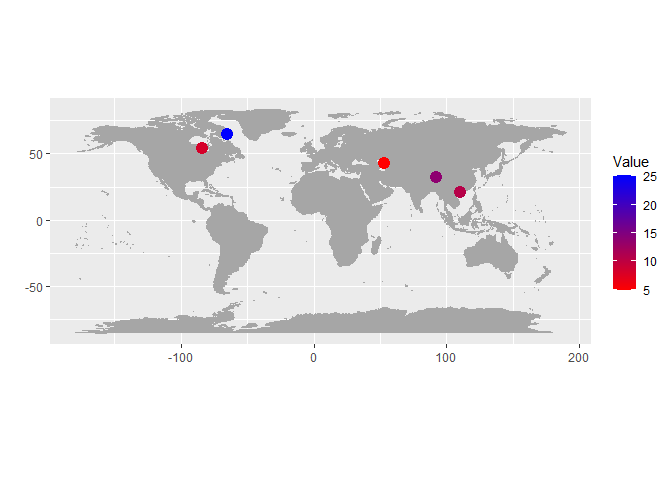
I have coordinates of 27 locations, with different coordinates(lat and long), with a value that is a statistic, this value varies every location.
I have the map and points on the map working fine, however i cannot change my colour scheme in the aes function, they only do the default. I have tried lots of different commands. I would like a red-blue gradient colour with matching legend. I tried colourRpalette etc, but no luck. Help would be appreciated.
**Code below
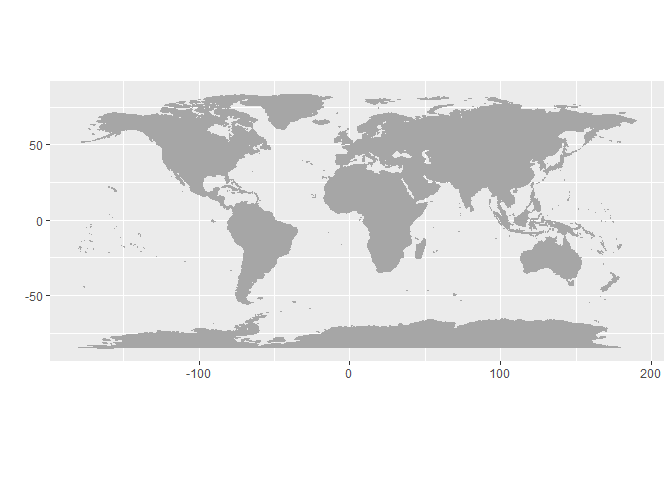
orld_map <- map_data("world")
#Create a base plot with gpplot2
p <- ggplot() + coord_fixed() +
xlab("") + ylab("")
#Add map to base plot
base_world_messy <- p + geom_polygon(data=world_map, aes(x=long, y=lat, group=group),
colour="gray65", fill= "gray65")
base_world_messy
###############add data points#################
cities <- read.csv("Coordinates_updated.csv", header=TRUE)
HI @bella29,
You can use any of the "filled" plotting symbols (pch 21...25). In this way you can specify the "fill" colour of the symbol and the colour (and thickness) of the "outline". e.g.
# Change symbol background fill and line color
ggplot(iris, aes(Sepal.Length, Sepal.Width)) +
   geom_point(shape = 21, fill = "lightblue", color = "red",  size = 3)