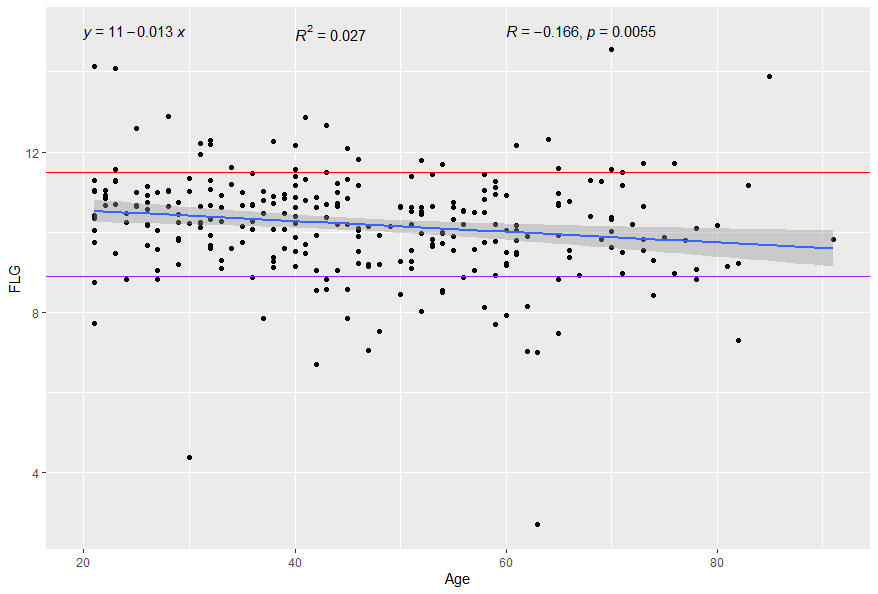
I tried using "signif()" function as well, but was having issues. The reason this is important, is because R rounds up the y-intercept value in the equation. In this case it's 11: y = -0.013x +11. However, it should be 10.81 (according to excel). Is there a way to get around this, so it doesn't round up?
I think that unfortunately ggpubr has not been designed to let you tailor this in a super elegant way, though perhaps you could request that from the ggpubr creators as a feature request.
You can however completely control what is printed, but you may need to do additional work, to cobble together the elements you want. Here is an example. First I show the out of the box rounding that ggpubr naturally gives you. thereafter I demonstrate arbitrary precision (i chose 3 decimal points, but you can do anything here).
library(tidyverse)
library(ggpubr)

#out of the box
ggscatter(mtcars, x = "wt", y = "mpg", add = "reg.line") +
  stat_cor(label.x = 3, label.y = 34) +
  stat_regline_equation(label.x = 3, label.y = 32)


# construct your own formatting

(mylm <- lm(data=mtcars,
           formula=mpg~wt))

(my_eq <- scales::comma(mylm$coefficients,accuracy = 0.001))
(my_eq_text <- paste0("y = ", my_eq[[1]], " ",my_eq[[2]],"x"))

ggscatter(mtcars, x = "wt", y = "mpg", add = "reg.line") +
  stat_cor(label.x = 3, label.y = 34) +
  stat_regline_equation(label.x = 3, label.y = 32,
                        mapping=aes(label=my_eq_text),
                        output.type="text")