Charts and Beautiful

Hey, i am pretty new in R studio programming so i want to ask for some advice from you guys.

In my project about car accedent i have to make beautiful plots.
after i have search all around google i found some good codes but unfortuntlly i am struggling to understand
which parts of the codes i have to change for my data..
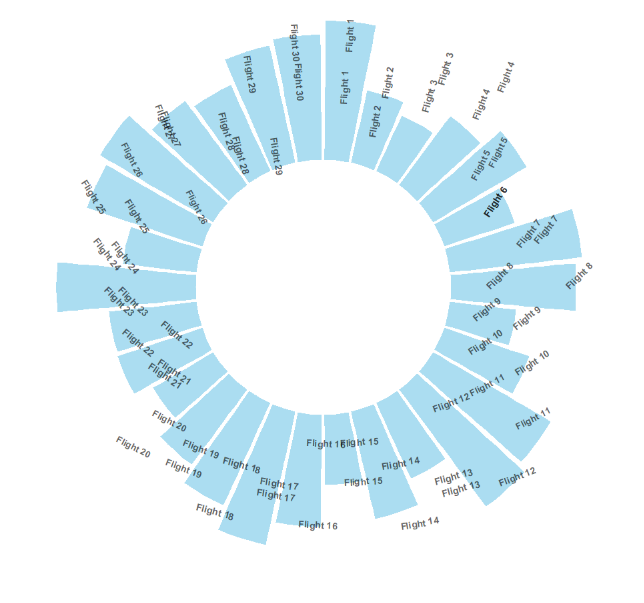
for example chart like this:
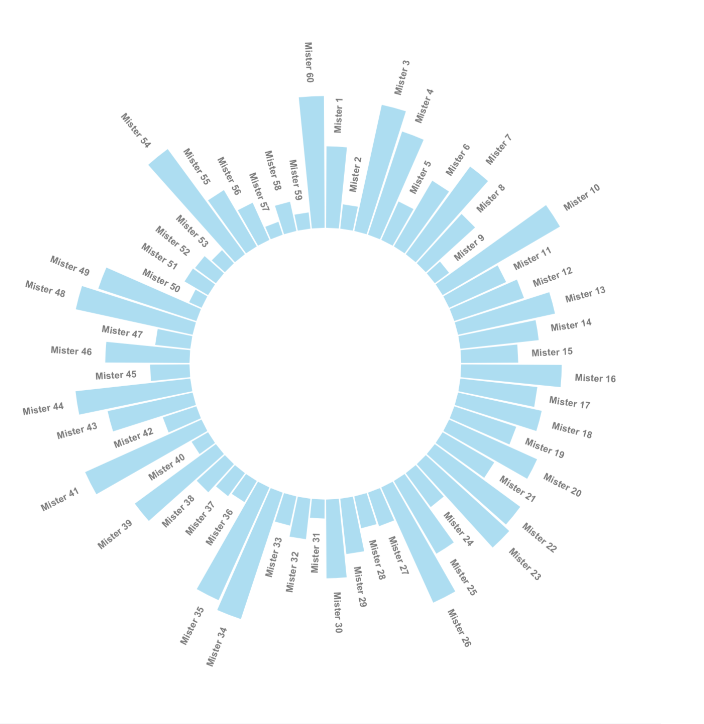
# Libraries
library(tidyverse)
 
# Create dataset
data <- data.frame(
  id=seq(1,60),
  individual=paste( "Mister ", seq(1,60), sep=""),
  value=sample( seq(10,100), 60, replace=T)
)
 
# ----- This section prepare a dataframe for labels ---- #
# Get the name and the y position of each label
label_data <- data
 
# calculate the ANGLE of the labels
number_of_bar <- nrow(label_data)
angle <-  90 - 360 * (label_data$id-0.5) /number_of_bar     # I substract 0.5 because the letter must have the angle of the center of the bars. Not extreme right(1) or extreme left (0)
 
# calculate the alignment of labels: right or left
# If I am on the left part of the plot, my labels have currently an angle < -90
label_data$hjust<-ifelse( angle < -90, 1, 0)
 
# flip angle BY to make them readable
label_data$angle<-ifelse(angle < -90, angle+180, angle)
# ----- ------------------------------------------- ---- #
 
 
# Start the plot
p <- ggplot(data, aes(x=as.factor(id), y=value)) +       # Note that id is a factor. If x is numeric, there is some space between the first bar
  
  # This add the bars with a blue color
  geom_bar(stat="identity", fill=alpha("skyblue", 0.7)) +
  
  # Limits of the plot = very important. The negative value controls the size of the inner circle, the positive one is useful to add size over each bar
  ylim(-100,120) +
  
  # Custom the theme: no axis title and no cartesian grid
  theme_minimal() +
  theme(
    axis.text = element_blank(),
    axis.title = element_blank(),
    panel.grid = element_blank(),
    plot.margin = unit(rep(-1,4), "cm")      # Adjust the margin to make in sort labels are not truncated!
  ) +
  
  # This makes the coordinate polar instead of cartesian.
  coord_polar(start = 0) +
  
  # Add the labels, using the label_data dataframe that we have created before
  geom_text(data=label_data, aes(x=id, y=value+10, label=individual, hjust=hjust), color="black", fontface="bold",alpha=0.6, size=2.5, angle= label_data$angle, inherit.aes = FALSE ) 
 
p

I want to ask you guys for help to marker me the places that i have to change and what i have to put inside of each change.
thanks you!

1 Like

Hi @Tomer , first for start you need have the data with the same order of this example:

Next, is necesary evaluate line by line if the data adjust of the entire code.

# > data
# id individual value
# 1   1   Mister 1    67
# 2   2   Mister 2    75
# 3   3   Mister 3    50
# 4   4   Mister 4    89
# 5   5   Mister 5    36
# 6   6   Mister 6    50
# 7   7   Mister 7    30
# 8   8   Mister 8    46
# 9   9   Mister 9    11
# 10 10  Mister 10    53
# 11 11  Mister 11    58
# 12 12  Mister 12   100

hey, so i have been trying to fix the code and thats the result that i have got

i used the nycflights13 data base
and thats the code.

Create dataset

data <- data.frame(
day=seq(1,30),
carrier=paste( "Flight ", seq(1,30), sep=""),
flight=sample( seq(10,100), 60, replace=T)
)

----- This section prepare a dataframe for labels ----

Get the name and the y position of each label

label_data <- data

calculate the ANGLE of the labels

number_of_bar <- nrow(label_data)
angle <- 90 - 360 * (label_data$day-0.5) /number_of_bar # I substract 0.5 because the letter must have the angle of the center of the bars. Not extreme right(1) or extreme left (0)

calculate the alignment of labels: right or left

If I am on the left part of the plot, my labels have currently an angle < -90

label_data$hjust<-ifelse( angle < -90, 1, 0)

flip angle BY to make them readable

label_data$angle<-ifelse(angle < -90, angle+180, angle)

----- ------------------------------------------- ----

Start the plot

p <- ggplot(data, aes(x=as.factor(day), y=flight)) + # Note that id is a factor. If x is numeric, there is some space between the first bar

This add the bars with a blue color

geom_bar(stat="identity", fill=alpha("skyblue", 0.7)) +

Limits of the plot = very important. The negative value controls the size of the inner circle, the positive one is useful to add size over each bar

ylim(-100,120) +

Custom the theme: no axis title and no cartesian grid

theme_minimal() +
theme(
axis.text = element_blank(),
axis.title = element_blank(),
panel.grid = element_blank(),
plot.margin = unit(rep(-1,4), "cm") # Adjust the margin to make in sort labels are not truncated!
) +

This makes the coordinate polar instead of cartesian.

coord_polar(start = 0) +

Add the labels, using the label_data dataframe that we have created before

geom_text(data=label_data, aes(x=day, y=flight+10, label=carrier, hjust=hjust), color="black", fontface="bold",alpha=0.6, size=2.5, angle= label_data$angle, inherit.aes = FALSE )

p

i will appreacte any kind of help to fix the visual of this plot.
thank you.

This topic was automatically closed 21 days after the last reply. New replies are no longer allowed.

If you have a query related to it or one of the replies, start a new topic and refer back with a link.