I am a little unsure on how I can use ggplot to achieve this. I was hoping to have the bars grouped by salinity that way it is easy to see a comparison between proportion alive for each site depending on the salinity you are looking at: SQ 0.2, MD 0.2 ______ SQ 1, MD 1 ______ etc. But I am not really sure on how to achieve that. Any and all help is appreciated.
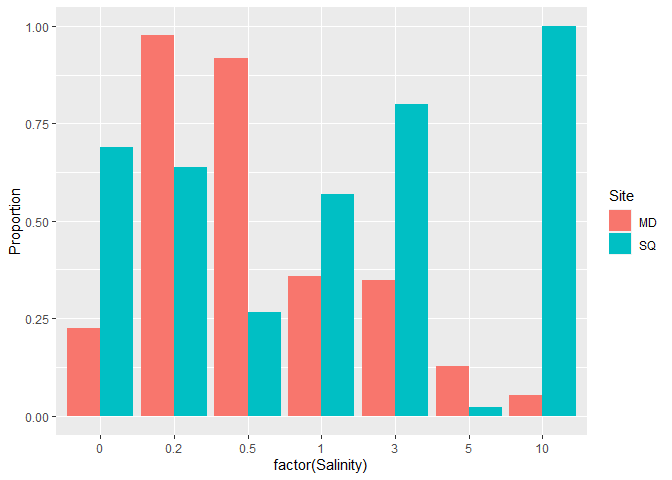
Is this the sort of thing you want to do? Notice that I made Salinity a factor so that the pairs of bars would be evenly spaced rather than packed on the left side and spread out on the right side of the x axis as the numeric values.
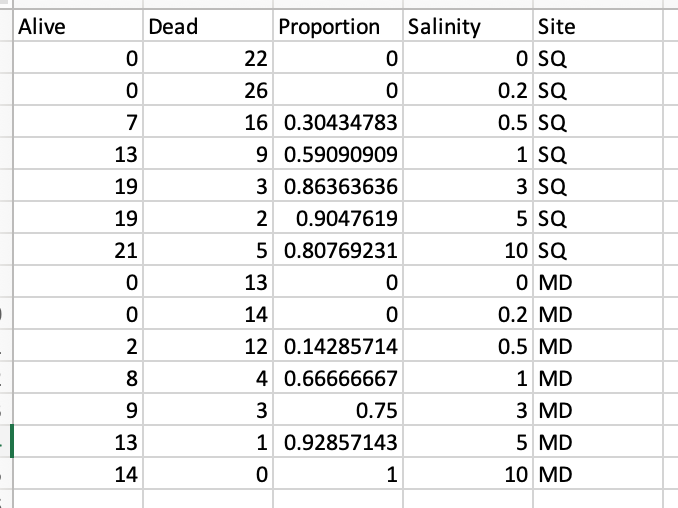
DF <- data.frame(Proportion = runif(14),
                 Salinity = c(0,.2,.5,1,3,5,10,0,.2,.5,1,3,5,10),
                 Site = rep(c("SQ","MD"), each = 7))
library(ggplot2)
ggplot(DF, aes(x = factor(Salinity), y = Proportion, fill = Site)) +
  geom_col(position = "dodge")