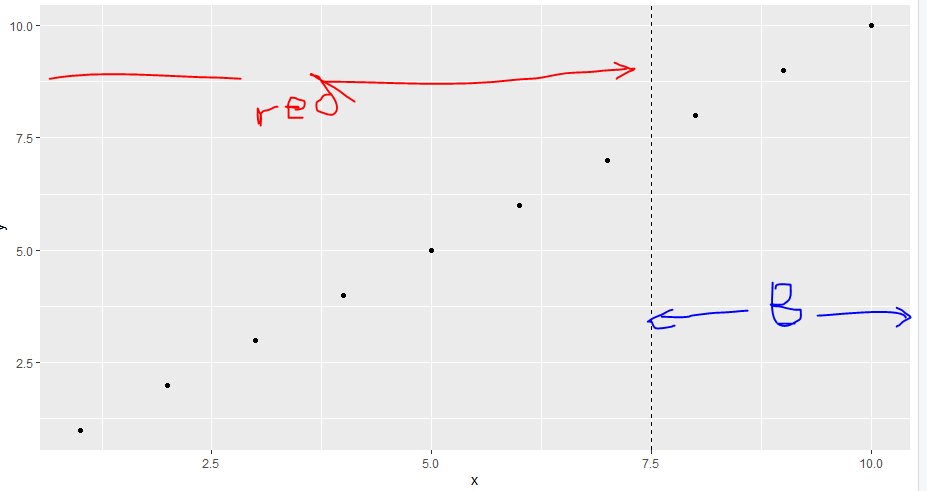
Here is one approach. It works because starting the colored area at zero makes sense with your data. If you need more flexible placement of the colors, you can use geom_rect where you can set xmin, xmax, ymin, and ymax.
library(ggplot2)
df <- data.frame(x=1:10,y=1:10)
RED <- data.frame(X=c(1,7.5), Y = 10)
BLUE <- data.frame(X=c(7.5,10), Y = 10)
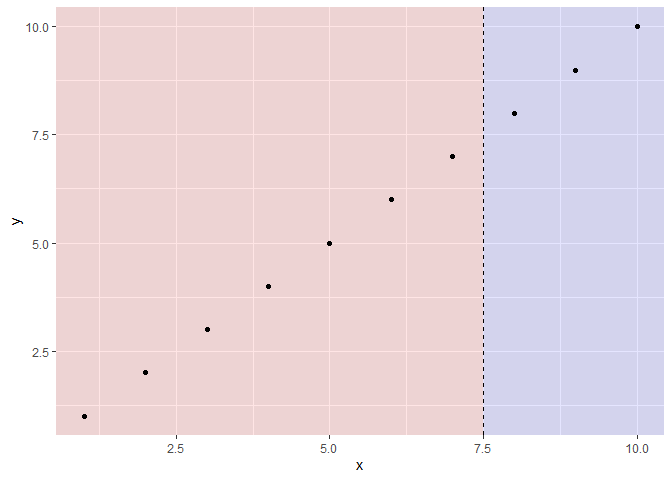
ggplot(df,aes(x,y))+geom_point()+
geom_vline(xintercept=7.5,linetype="dashed") +
geom_area(aes(x=X,y=Y),data=RED,alpha=0.3,fill="red")+
geom_area(aes(x=X,y=Y),data=BLUE,alpha=0.3,fill="blue")
thank you for the support ,, but I got one more challenge ,, the background still showing a grey area surrounding both of the (red & blue) color . is their away to get rid of this grey surrounding ?
Here are two versions of changing the gray color. In the first, I simply change the theme so that the gray area is white. In the second, I adjust the values in the RED and BLUE data frames and change the axis limits to have the color extend beyond the data.
ggplot(df,aes(x,y))+geom_point()+
  geom_vline(xintercept=7.5,linetype="dashed") +
  geom_area(aes(x=X,y=Y),data=RED,alpha=0.3,fill="red")+
  geom_area(aes(x=X,y=Y),data=BLUE,alpha=0.3,fill="blue")+
  theme_bw()

#Second method
RED <- data.frame(X=c(-1, 7.5), Y = 11)
BLUE <- data.frame(X=c(7.5, 11), Y = 11)
ggplot(df,aes(x,y))+geom_point()+
  geom_vline(xintercept=7.5,linetype="dashed") +
  geom_area(aes(x=X,y=Y),data=RED,alpha=0.3,fill="red")+
  geom_area(aes(x=X,y=Y),data=BLUE,alpha=0.3,fill="blue")+
  coord_cartesian(xlim = c(0,10), ylim = c(0,10))+
  theme_bw()