Colour gradation

Hi everyone!

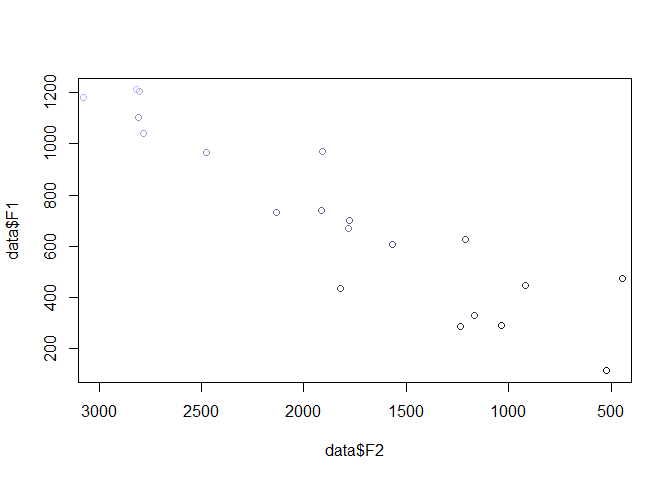
I wonder if I can plot a serie of dots getting a colour shade for each group (named type in my case).
That's my script:

data <- read.csv("prova.csv", header=TRUE, sep=";", dec = ".")

plot(data$F2, data$F1,
     xlim=c(3000,500) , ylim=c(1200,200), 
     pch=18, 
     cex=2, 
     col=data$type,
     xlab="F2", ylab="F1",
     main="Sample"
)


where for each "type" I have different samples.
Thank you in advance, valentina

It would help if you could provide a reprex, and be more specific as to how the "shade" should vary.

Here is something like what you asked:

data <- data.frame(F1 = seq(from = 200, to = 1200, length.out = 20) + rnorm(20, sd = 100),
                   F2 = seq(from = 500, to = 3000, length.out = 20) + rnorm(20, sd = 300),
                   type = 1:20)

mycol <- hsv(h = .7, s = .3, v = (data$type)/max(data$type))

plot(data$F2, data$F1,
     xlim = c(3000,500),
     col = mycol)

Created on 2022-12-14 by the reprex package (v2.0.1)

This topic was automatically closed 21 days after the last reply. New replies are no longer allowed.

If you have a query related to it or one of the replies, start a new topic and refer back with a link.