round(cor(data),2)
PAO PAA The JE POT LEC RAI PLP
PAO 1.00 -0.77 0.93 -0.91 0.66 0.89 -0.83 -0.86
PAA -0.77 1.00 -0.60 0.90 -0.33 -0.67 0.96 0.77
The 0.93 -0.60 1.00 -0.75 0.52 0.79 -0.67 -0.83
JE -0.91 0.90 -0.75 1.00 -0.42 -0.84 0.92 0.72
POT 0.66 -0.33 0.52 -0.42 1.00 0.60 -0.41 -0.55
LEC 0.89 -0.67 0.79 -0.84 0.60 1.00 -0.82 -0.75
RAI -0.83 0.96 -0.67 0.92 -0.41 -0.82 1.00 0.83
PLP -0.86 0.77 -0.83 0.72 -0.55 -0.75 0.83 1.00
library("PerformanceAnalytics")
chart.Correlation(don, histogram=TRUE, pch=19)
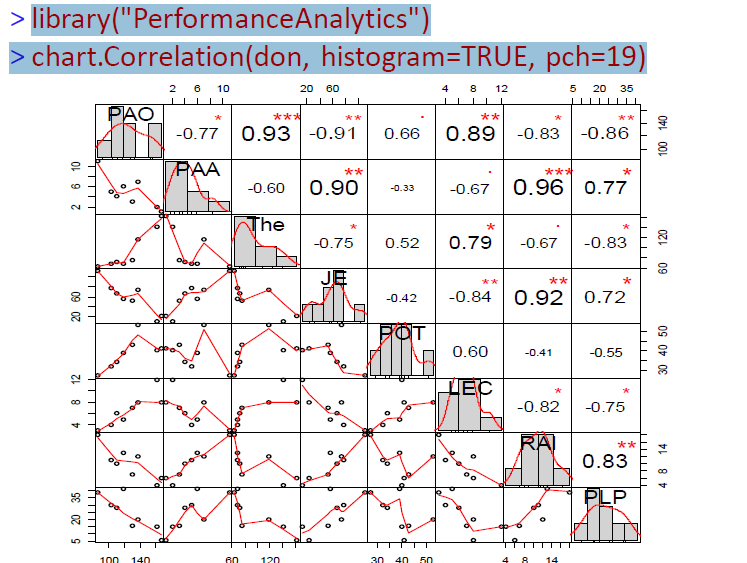
this graph shows the degree of correlation between two values. 1 and -1 indicate perfect linear relationship, while 0 indicates no linear relationship.
For example: The relation between The and PAO (0.93) is really strong, on the contrary POT and PAA (-0.33) is weaker
This topic was automatically closed 21 days after the last reply. New replies are no longer allowed.
If you have a query related to it or one of the replies, start a new topic and refer back with a link.