Good morning everyone,
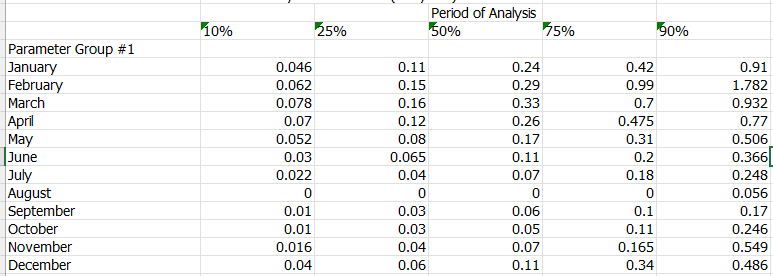
I have data like those in the figure for three different scenarios. I would then create boxplots for each scenario for each month in the same plot. I made several attempts, but I couldn't get it. Do you have any suggestions?
seems like you may be trying to do the following
#made up random data with same structure as yours
set.seed(1)

mnths <- 1:12
names(mnths) <- month.abb

(start_data <- imap_dfr(mnths,\(x,n) {y <- rnorm(100)
  tibble(
    month=factor(n),
    y10 =  quantile(y, 0.1),
    y25 = quantile(y, 0.25),
    y50 = median(y),
    y75 = quantile(y, 0.75),
    y90 =quantile(y, 0.90),
  )
  }))

# plotting it in the form of a boxplot, but with your 5 value for the 5 locations of the boxplot
ggplot(start_data, aes(x=month,group=month)) +
  geom_boxplot(
    aes(ymin = y10,
        lower = y25,
        middle = y50,
        upper = y75,
        ymax = y90),
    stat = "identity"
)This topic was automatically closed 42 days after the last reply. New replies are no longer allowed.
If you have a query related to it or one of the replies, start a new topic and refer back with a link.