Yanni
June 1, 2023, 8:55am
1
I want to standardize the monthly signal in the range of [-1,1] by yyyymm.
df$x<- scale(df$signal, center = 0, scale = max(abs(df$signal)))
Thank you very much!
permno yyyymm signal
10001 201705 1.47
Yanni
June 1, 2023, 8:57am
2
permno yyyymm signal
10001 201705  1.47
10026 201705  0.32
10028 201705  -0.36
10001 201706  1.45
10026 201706  0.31
10028 201706  0.22
10001 201707  -1.41
10026 201707  0.32
10028 201707  -0.28
Here is one way
library(tidyverse)
# example data
df <- readr::read_delim("permno yyyymm signal
10001 201705 1.47
10026 201705 0.32
10028 201705 -0.36
10001 201706 1.45
10026 201706 0.31
10028 201706 0.22
10001 201707 -1.41
10026 201707 0.32
10028 201707 -0.28"
,delim = " ")

#solution starts here
split(df,~df$yyyymm) |> map_dfr(\(x){
  x$scaled_x <- as.numeric(scale(x$signal,
                                 center = 0,
                                 scale = max(abs(x$signal))))
 x
})
Yanni
June 7, 2023, 11:47am
4
Thank you very much for your reply! But it seems that the results are not standardized by month
Use group feature from dplyr package will solve this easily.
> library(tidyverse)
> df %>% group_by(yyyymm) %>% mutate(signal = scale(signal,center = 0,scale = max(abs(signal))))
# A tibble: 9 × 3
# Groups:   yyyymm [3]
  permno yyyymm signal[,1]
   <dbl>  <dbl>      <dbl>
1  10001 201705      1
2  10026 201705      0.218
3  10028 201705     -0.245
4  10001 201706      1
5  10026 201706      0.214
6  10028 201706      0.152
7  10001 201707     -1
8  10026 201707      0.227
9  10028 201707     -0.199
Relevant information can be found at Grouped data • dplyr
Yanni
June 7, 2023, 12:21pm
6
Thank you very much! With your answer, I finally got what I wanted!
df %>%
  group_by(yyyymm) %>%
  mutate(signal1 = rescale(signal, to = c(-1, 1))) %>%
  ungroup
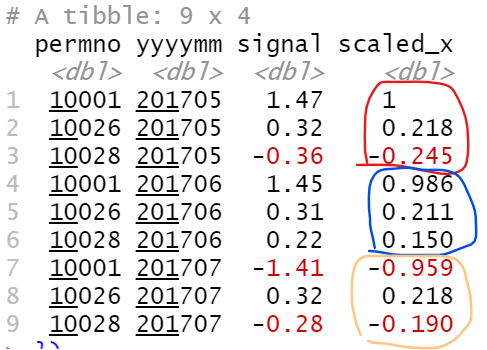
The solution I supplied, on the data provided gives me the result
# A tibble: 9 × 4
  permno yyyymm signal scaled_x
   <dbl>  <dbl>  <dbl>    <dbl>
1  10001 201705   1.47    1
2  10026 201705   0.32    0.218
3  10028 201705  -0.36   -0.245
4  10001 201706   1.45    1
5  10026 201706   0.31    0.214
6  10028 201706   0.22    0.152
7  10001 201707  -1.41   -1
8  10026 201707   0.32    0.227
9  10028 201707  -0.28   -0.199
I don't know why you saw different numbers, perhaps R version ?
system
June 14, 2023, 12:44pm
8
This topic was automatically closed 7 days after the last reply. New replies are no longer allowed.