I use markdown to document and walk colleagues through the process I've followed to get to the analysis outputs / data products I share with them, as well as problems I've hit that need discussing. And I use different documents during the development process.
I actually start developing code in a rmarkdown notebook. They're really cool cause you can run each chunk of code and the output renders below it! So it's really good for sanity checks and having an overview of the analysis visible as you develop it. You can even combine chunks in different languages! So if you needed to access data from a database, you could write an SQL chunk to extract it. Once I think I've got the analysis I want, I decide whether and what code to strip into R scripts or function scripts that can be sourced (or run on a cluster if necessary), echoing @apreshill approach. But, when I do, I use the chunk naming notation:
## ---- chunk-name ----
in my scripts. This allows me to use knirt::read_chunk() function in my Rmd, to read in the code from my scripts and call the chunks in the original Rmarkdown notebook. This way I only have one copy of the code (so if it changes, it will automatically change in the rmarkdown document when re-rendered) but can still include it in documentation which I now consider an indispensible part of the workflow. I find being able to show code, inputs, outputs and notes as well as links to literature or other sources of info that contributed to the development of the code the best way to show and tell what I did (to my future self as well as others). They're also a great way to document metadata.
Finally, echoing @foundinblank, I worked for a couple of years remotely from my collaborators, skyping to discuss progress and decide next steps. The best I found to manage this was to record the progress, ideas and any problems I'd hit (either with the analysis or often even in the data itself) in and rmarkdown document so we had something to go through in our meetings. I also made use of the interactive html features rmarkdown offers, like searchable tables of (reasonably sized) data using functions in the DT package (the default printing of dfs and tibbles is now pretty good in notebooks) or making plots interactive using plotly. That way collaborators could troubleshoot aspects of the data or zoom into to specific parts of plots without asking me to replot stuff or provide separate data files. All the information they needed to think through the problem were there in the report!
Finally, once you get the hang of markdown, it opens the door to start making websites, blogs and even presentations...all through R!
I share @Ranae's concern when trying to work out how to switch to using RMarkdown for my scientific work. Trying to work out how to use them when I might need to run the same functions over a thousand different inputs is tricky—do I set up the script as a function that can be called from bash, and generate a report for each input, or whole, massive, iteration inside an Rmd chunk?
I've been wanting to try a makefile-and-Rmd-based workflow ever since @datandme tweeted about one, so thanks for posting that, @zkamvar!
With the caveat that I've only read about this topic, have you looked at the Knit with Parameters option for RMarkdown in RStudio? From my understanding it lets you produce a single report and then input different parameters, such as a data set, if the resulting report needs to be the same for multiple data sets.
This is the RStudio site explaining this type of report:
I've used the parameterized reports and they work quite well. The ezkintr vignette shows a good use case for this with multiple data sets in the same project.
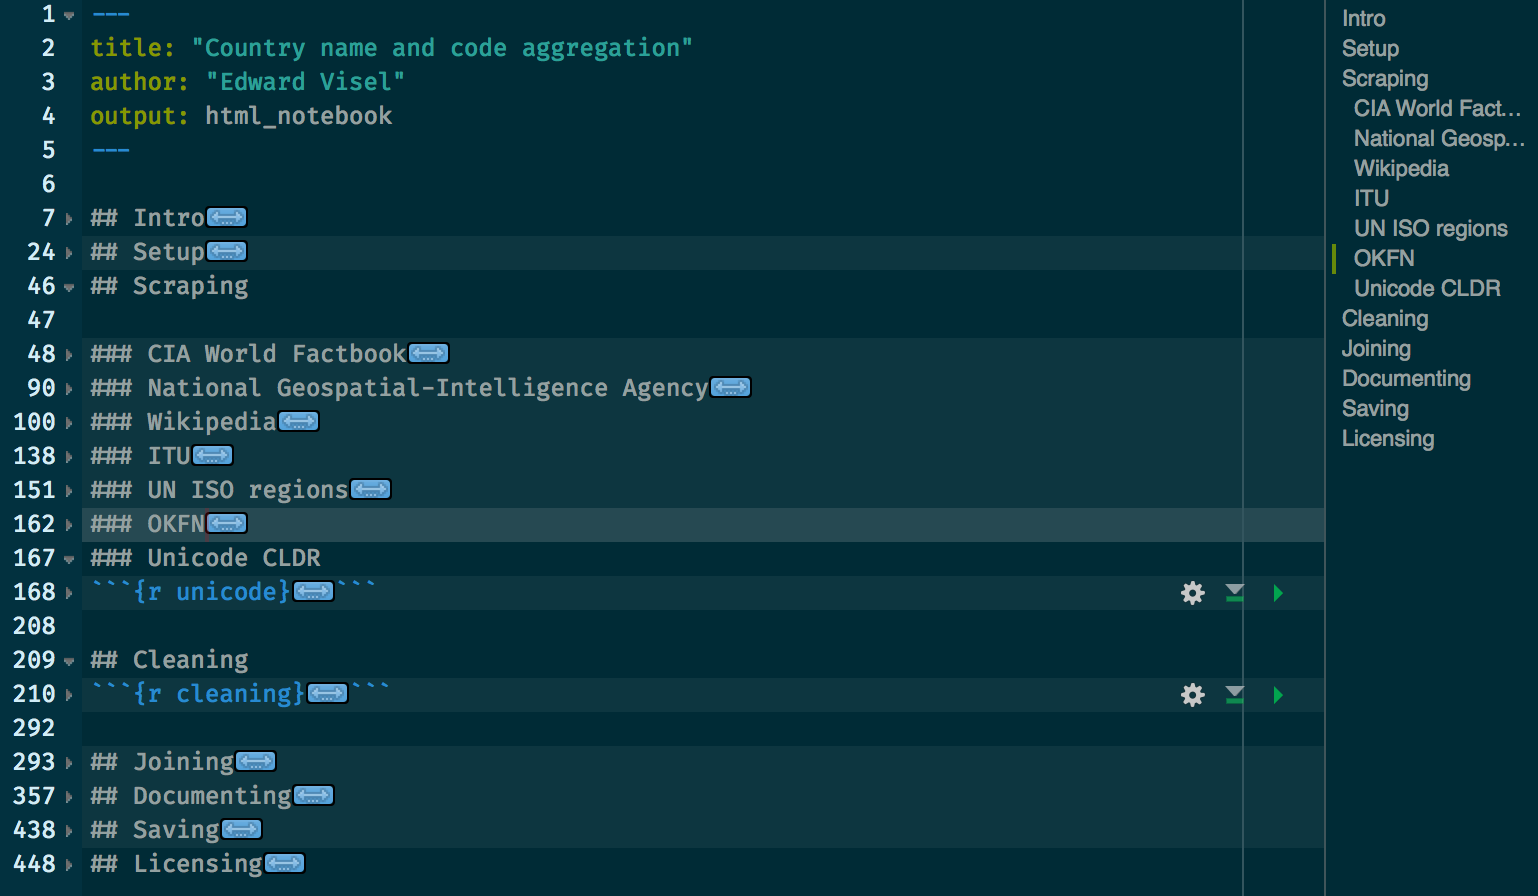
One simple-but-powerful tool for working with long RMarkdown scripts in RStudio that I really like is code folding. You can not just fold functions, but also chunks or entire sections defined by Markdown headings, so a 500 line script can look like
or even shorter, if it's collapsed further. If you organize your headings well and keep the parts you're not working on collapsed, it's really easy to navigate an enormous script. At some point it may still make sense to break parts out, organizing them via a Makefile, vigorous use of the child chunk option, or creative use of bookdown, but for most projects I find splitting is overkill for my purposes.
I use RMarkdown for all my scripts, not just reports because I can have better organization. If you ever need to run the script repeatedly and found RMarkdown awkward for that, you can always convert a RMarkdown into a script.
With RMarkdown you get
notes, reference, thoughts in markdown format outside code, much easier to read compare to comments in code.
I keep comments that need to stay with code in code, but found there are a lot of things I want to keep outside of code, especially my plan and findings. That could be extremely helpful if you need to pick up something several months later.
code chunks.
You can organize your code with functions, foldable comments (you can use # comment ---- to create foldable comments in script, and they will show in outline), but chunk is more flexible. You can run selected code chunks repetitively, much easier than selecting a section of code and evaluate it. Code chunks that no longer needed to be run but still good to keep can be marked with eval=FALSE and it will not be included.
outline is great to organize long RMarkdown document.
To develop my shiny app, I create a RMarkdown for every major task, record notes and reference, experiment with ideas etc. When I have working code ready to be incorporated into the shiny app, I copy the code into app. For longer code sections, I create foldable comments around them, fold it so it's much easier to select that section and copy it.
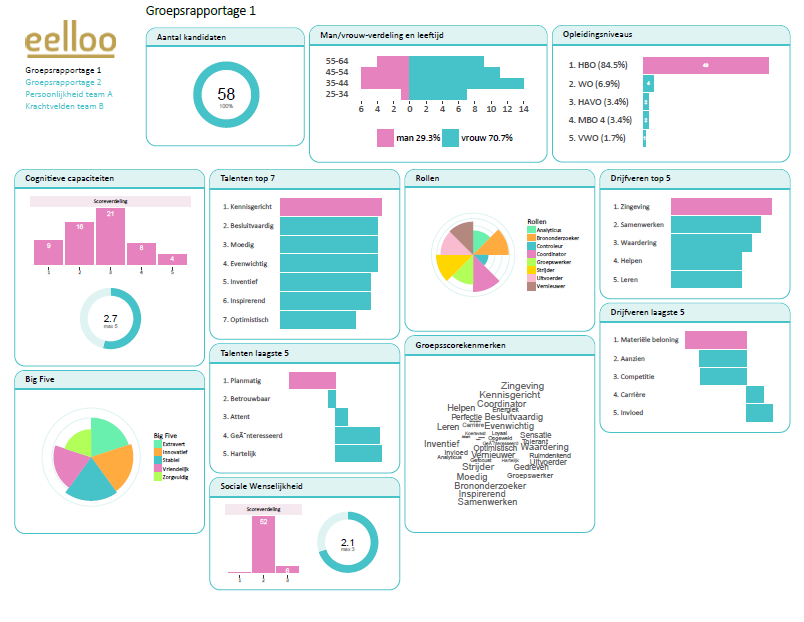
At eelloo we have been using Rmarkdown for over two years now. All our research reports are designed and generated with it. Recently we introduced a data dashboard like report, that is completely made in Rmarkdown and generated as a pdf document.
Here are some examples gathered in one document:
Ofcourse it's up to you if it can help convincing you using Rmarkdown, but to me the possibilities it gives (with the help of some LaTex and ggplot2) seem bounderless.
I do a lot of reports that change based on minor tweaks to the code. It's nice to set things up so that I never have to rewrite the verbiage, just change the code (which I would have to do anyway). R Notebooks are also a godsend for viewing the results in-line, and therefore returning to the results later without consciously saving every png. I can't imagine my workflow without them at this point.
@martin.R, I am working on some example code, but I haven't had much time lately to complete it.
Actually there is quite some LaTex code involved. The rounded corners are made by using mdframed LaTeX package. This package offers rounded boxes in which the ggplot2 graphs can be embedded using Rmarkdown. I don't use grid.arrange, all the lay out features are defined in (sub) pages in LaTeX.
@martin.R, you're welcome. I am not a LaTeX expert, and for me as an R programmer, the code I use is luckily straightforward enough. So, I hope to be able to give you some example code soon.
One thing I don't think has been mentioned so far is how helpful it is at times to use rmarkdown::render() instead of the 'knit' button in RStudio when working with RMarkdown.
This can render the following RMarkdown file demo.Rmd:
---
output: html_document
---

```{r}
cyl4
```
But if you try to use the 'knit' button in RStudio to render demo.Rmd you will get an error (as the knit button requires the Rmd file to be self contained).
I find using rmarkdown::render() in this way is helpful when scripts are in development (e.g. while files like 02-clean.R that @apreshill mentions are being developed and refined). Your Rmd file can remain simple and static while your code is continually updated (e.g. I might do this to create an iterative data cleaning report).
I've also used it to try and avoid the issue @Ranae has encountered with Rmd files becoming too cumbersome to work with.
This approach also makes it easy to 'dip your toe in the water' if you have existing R scripts and want to be able to start incorporating RMarkdown into your workflow without too much work.
This probably isn't best practice in general but currently works well for me in certain situations.
I find R Markdown invaluable but not particularly for presenting reports, which I rarely have to do. I use it mainly for my own purposes as a means of recording milestones in my work. Perhaps I am more disorganised than other people but if my R code for a project is in one place, the data in another and the results of running the code somewhere else then I can easily lose track of which data belongs to which code and which results. That is particularly a problem when I am constantly running slightly revised versions of my code.
What I do then when I reach a key stage in a project is to put the code into a Markdown document with accompanying explanation and create a pdf document. To make sure I keep track of that I keep a daily journal which gives links to all documents created on each day that I work.
By key stage, I don't necessarily mean the end of a project. For instance yesterday my code was not giving reasonable results so I was able to create a markdown document that included the code, explanations using Latex of what it was supposed to be doing and the results showing that it was not doing it right. That process clarified my thinking and uncovered errors in the code.
I like the idea of RMarkdown, and I've got a battery of reports that I generate every week that I OUGHT to have written in RMD, but I hate the fact that my output choices are basically only pdf and html--both of those are TERRIBLE choices in terms of storing data. If I ever need to look at my data again and read it back into R (and I'm almost positive that, at some point, I will), I'm going to want to punch the guy who made me scrape a pdf file.
Plus, even kables look terrible compared with a nicely formatted table in Excel, particularly with data that's mixed number types (numbers, percentages, currency, etc).
I write most of my data out in csv format from my Rmd (or save the query if it's a database). The document/report itself wouldn't contain tables with these CSVs (usually they're individual records— and I don't think of the output as being a form of data storage), but when I want to include tables, I'm really into huxtable right now: https://hughjonesd.github.io/huxtable/
There are a bunch of other table packages, too, for which David Hugh-Jones (the author of huxtable) made a nifty comparison table here.