Hi everyone.
I want to do a spearman correlation for a complex survey samples. I know that it's possible to use svycor from the package jtools but only to do pearson correlation, there is no fonction about that in the survey package.
Do you have any idear how to do that ?
Thank you
You can estimate the variance using svycov and then use cov2cor to get the correlation. This is buried in the survey package documentation and is exactly what jtools::svycor is doing if you look at the code of the function. Toy example below:
library(survey)
#> Loading required package: grid
#> Loading required package: Matrix
#> Loading required package: survival
#>
#> Attaching package: 'survey'
#> The following object is masked from 'package:graphics':
#>
#>     dotchart

data(api)
## one-stage cluster sample
dclus1<-svydesign(id=~dnum, weights=~pw, data=apiclus1, fpc=~fpc)

v<-svyvar(~api00+api99, dclus1)
vmat <- as.matrix(v)
attr(vmat, "var") <- NULL #remove extra info
attr(vmat, "statistic") <- NULL #remove extra info
cov2cor(vmat)
#>           api00     api99
#> api00 1.0000000 0.9650177
#> api99 0.9650177 1.0000000

jtools::svycor(~api00 + api99, design = dclus1, digits=7)
#>           api00     api99
#> api00 1.0000000 0.9650177
#> api99 0.9650177 1.0000000
Created on 2022-10-17 with reprex v2.0.2
thank you for your answer.
I also wanted to have the p-value of the correlation. do you know how to obtain it ?
I usually use this approach:
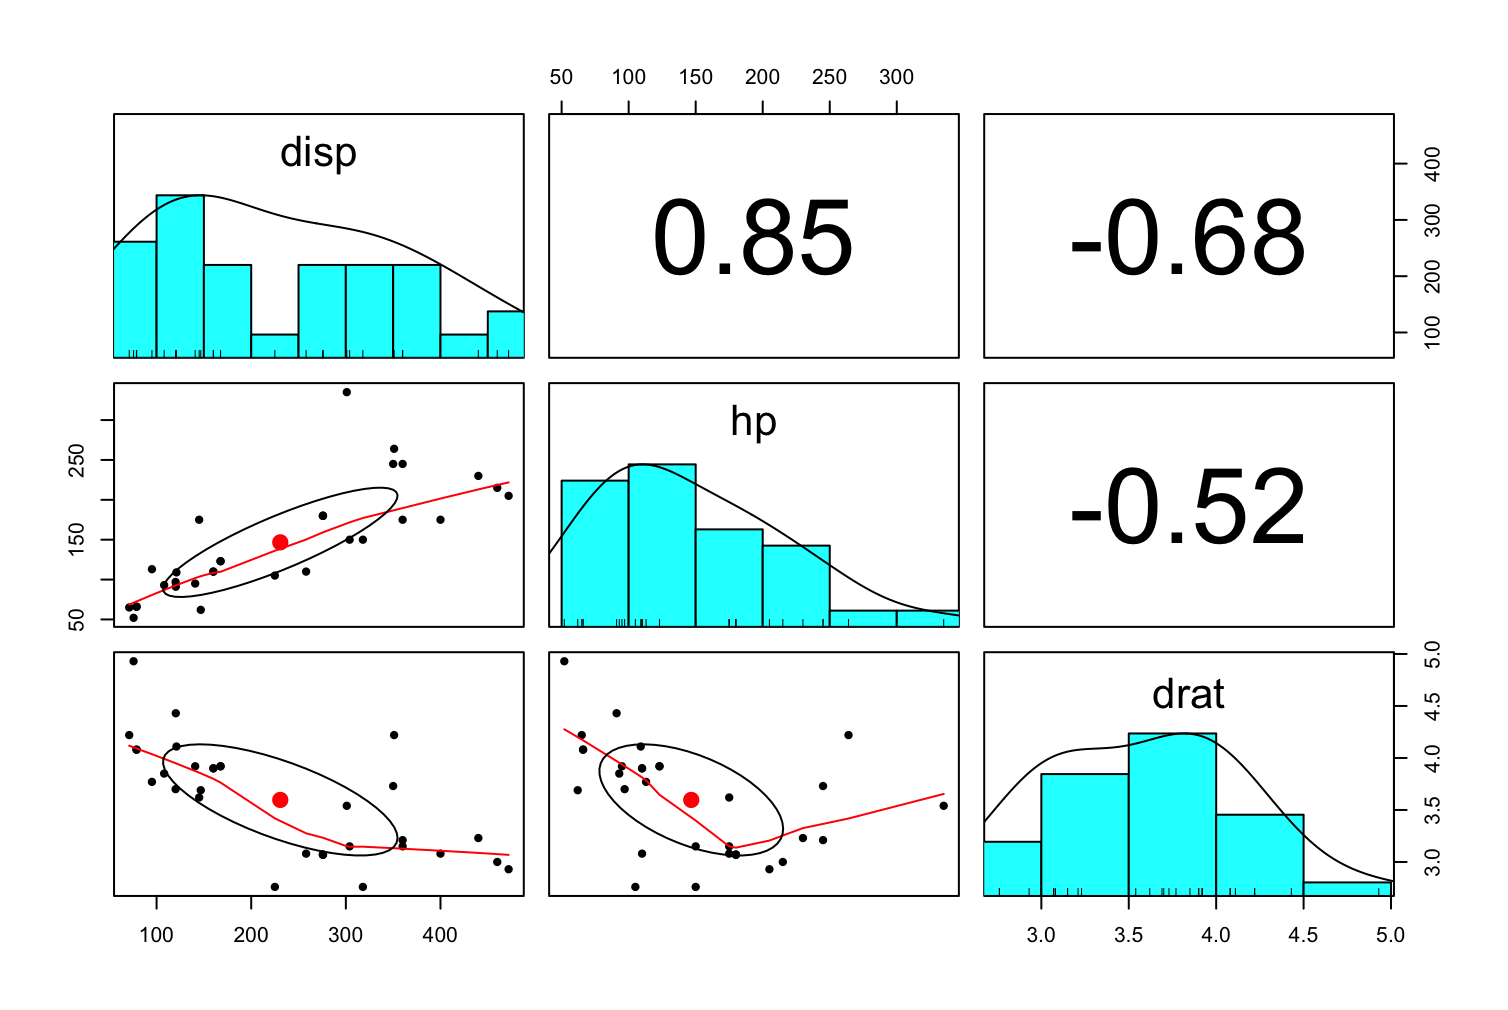
visual
library(tidyverse)

mtcars %>%
  select(disp, hp, drat) %>%
  psych::pairs.panels(method = "spearman")
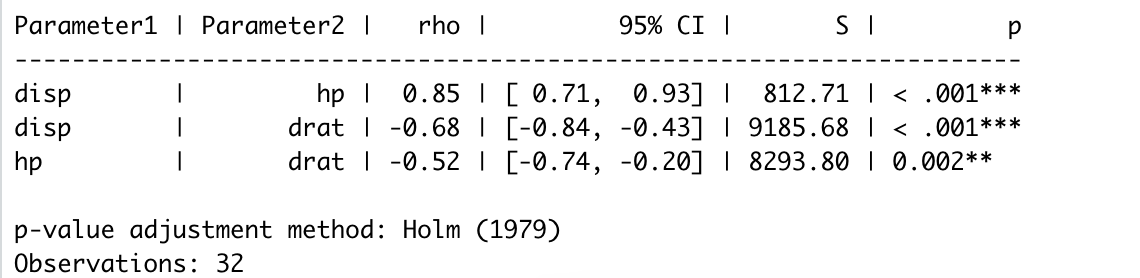
table
correlation::correlation(mtcars,
                         select = c("disp", "hp", "drat"),
                         # select2 = c("wt"),
                         method = "spearman",
                         p_adjust="holm")
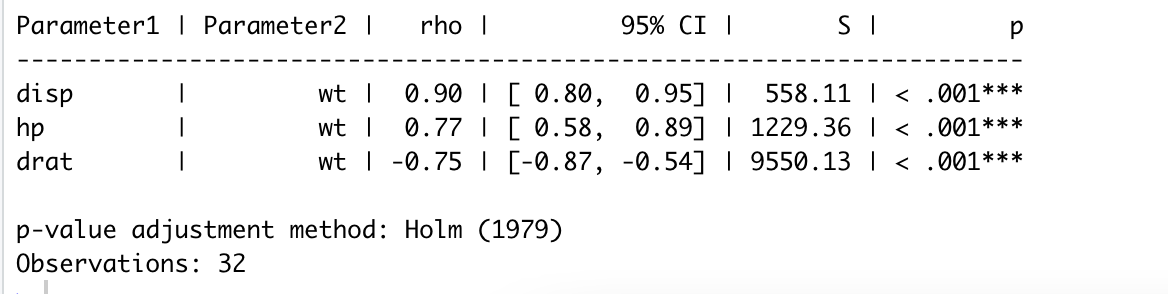
If you uncomment select2 = c("wt") and specify the variables, then the correlation will occur between the variables selected in point 1 compared to those in point 2 (in this case "wt")
correlation::correlation(mtcars,
                         select = c("disp", "hp", "drat"),
                         select2 = c("wt"),
                         method = "spearman",
                         p_adjust="holm")
OK, here's a way to do it that might seem odd way to do it but it will work. The p-value of the correlation coefficient is the same as the p-value in a simple linear regression.
library(survey)
#> Loading required package: grid
#> Loading required package: Matrix
#> Loading required package: survival
#>
#> Attaching package: 'survey'
#> The following object is masked from 'package:graphics':
#>
#>     dotchart

data(api)
## one-stage cluster sample
dclus1<-svydesign(id=~dnum, weights=~pw, data=apiclus1, fpc=~fpc)

v<-svyvar(~api00+api99, dclus1)
vmat <- as.matrix(v)
attr(vmat, "var") <- NULL #remove extra info
attr(vmat, "statistic") <- NULL #remove extra info
cov2cor(vmat)
#>           api00     api99
#> api00 1.0000000 0.9650177
#> api99 0.9650177 1.0000000

mout <- svyglm(api00~api99, design=dclus1)

coef(summary(mout))
#>               Estimate  Std. Error   t value     Pr(>|t|)
#> (Intercept) 95.2848309 14.98802393  6.357398 2.506160e-05
#> api99        0.9042905  0.02361015 38.300918 9.381896e-15

(p_value <- coef(summary(mout))[2, 4])
#> [1] 9.381896e-15
Created on 2022-10-18 with reprex v2.0.2
Unfortunately, these methods don't take into account the complex survey design.
This topic was automatically closed 42 days after the last reply. New replies are no longer allowed.
If you have a query related to it or one of the replies, start a new topic and refer back with a link.