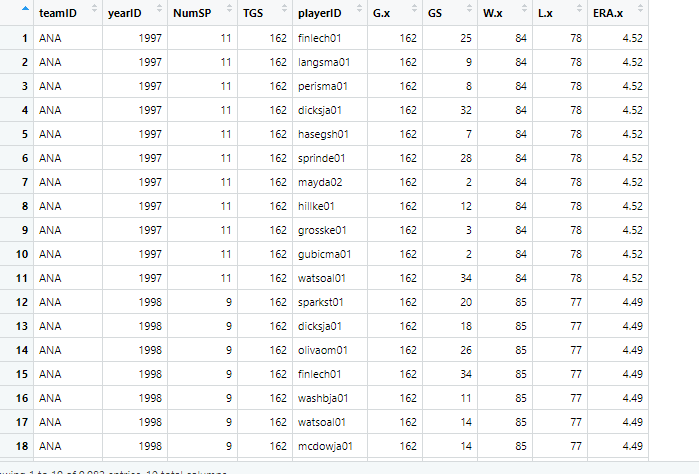
I am stumped and trying to create a dataframe with the first instance ONLY appearing for Year and Team from my FinalGS dataframe. Screengrab of this dataframe and associated code is below.
Presently, the FinalGS dataframe lists EVERY playerID that appeared in a game for that team. NumSP is the column I need to use for y axis ggplots....how do I create code to reduce every unique playerID to just ONE row per team in the FinalGS dataframe?
For example, for the the 1997 ANA, I need just the first row returned in a dataframe (e.g. finlech01 ) and not all 11 names currently listed after (e.g. langsma01, perisma01) for that specific team and year. Wanting to replicate this for all other unique year and team IDs to then perform analysis.
library(Lahman)
library(tidyverse)
library(dplyr)
library(tidyr)
library(purrr)
library(ggrepel)
View(LahmanData)
View(Pitching)
View(Teams)
Totals = merge(Teams, Pitching, by=c("yearID","teamID"))
View(Totals)

#To see how many total pitchers had a GS on the 2011 Milwaukee Brewers, 6 total
MIL <- filter(Totals, yearID == 2011, teamID == "MIL", GS > 0)
View(MIL)
#This below lists any pitcher with a GS on a club from 1990-2021, throwing 2022 out as the season is not complete
GSPitching1 <- filter(Totals, yearID < 2022, yearID >1989)
as_tibble(GSPitching1)
View(GSPitching1)

#This below is using dplyr group by and summarize to get INDIVIDUAL arms that has a GS in TeamGSUSE dataFrame
teamGSUSE <- GSPitching1 %>%
  select(yearID, teamID, playerID, G.x, GS, W.x, L.x, ERA.x)
View(teamGSUSE)
TeamGS <- GSPitching1 %>%
  group_by(yearID, teamID) %>%
  summarise(TGS = sum(GS))
head(TeamGS)
View(TeamGS)
head(teamGSUSE)
View(teamGSUSE)
library(utils)
##The issue here is bringing TGS from TeamGS over to teamGSUSE b/c there are differing column totals
#for total number of teams and total number of pitchers. e.g. 13 man pitching staffs for 1 team
#solved w/ join on 2 variables below
library(base)
#This below works to merge them ON TWO COLUMNS
merged <-merge(TeamGS, teamGSUSE, by = c('teamID', 'yearID'))

View(merged)

#This below creates a new DataFrame where a pitcher started a game/had a GS in that season, throws out 100% relief pitchers
GSmerged <- filter(merged, GS > 0)
View(GSmerged)

#Stumbled here and figured it out (hat tip to "ML")
# By TEAM and YEAR. Then COUNT N()
#Pipe then summarize number starts = n (). This works below!
#n() counts up the values into a new column
newmerged <- GSmerged %>%
  group_by(teamID, yearID, ) %>%
  summarise(NumSP = n())
View(newmerged)

#This merged the last two DataFrames into one for analysis and ggplot use with team stats and individual GS numbers by staff

FinalGS <-merge(newmerged, GSmerged, by = c('teamID', 'yearID'))

View(FinalGS)