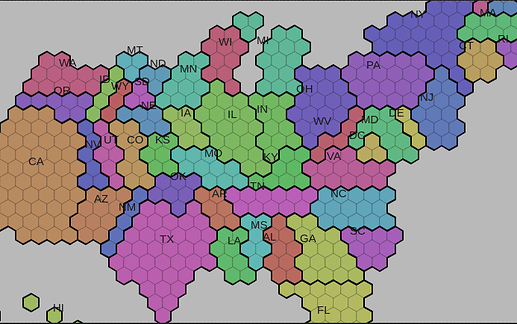
I am trying to recreate this cartogram (a tilegram, to be specific) but I cannot find documentation on how to generate the necessary data format. It generates a polygon for every electoral college in the US. My desire to reproduce it is to generate a similar cartogram for a different country (and of course different values to those of the electoral college).
If there is anyone who knows how to generate the necessary dataframe from shapefiles, I will really appreciate.
Data - tilegramsR/data at master · bhaskarvk/tilegramsR · GitHub
sf_FiveThirtyEightElectoralCollege
Simple feature collection with 538 features and 3 fields
Geometry type: POLYGON
Dimension:     XY
Bounding box:  xmin: 293.6239 ymin: 16.95238 xmax: 2495.803 ymax: 1661.333
old-style crs object detected; please recreate object with a recent sf::st_crs()
CRS:           NA
First 10 features:
old-style crs object detected; please recreate object with a recent sf::st_crs()
old-style crs object detected; please recreate object with a recent sf::st_crs()
   FID state tilegramVa                       geometry
1   02    AK          3 POLYGON ((293.6239 237.3333...
2   06    CA         55 POLYGON ((352.3486 847.619,...
3   06    CA         55 POLYGON ((322.9862 796.7619...
4   06    CA         55 POLYGON ((352.3486 745.9048...
5   06    CA         55 POLYGON ((322.9862 695.0476...
6   06    CA         55 POLYGON ((352.3486 644.1905...
7   02    AK          3 POLYGON ((322.9862 288.1905...
8   02    AK          3 POLYGON ((352.3486 237.3333...
9   06    CA         55 POLYGON ((411.0734 949.3333...
10  06    CA         55 POLYGON ((381.711 898.4762,...
Data for second second layer:
head(sf_FiveThirtyEightElectoralCollege.states)
state
<chr>
geometry
<S3: sfc_POLYGON>
AK	<S3: sfc_POLYGON>
AL	<S3: sfc_POLYGON>
AR	<S3: sfc_POLYGON>
AZ	<S3: sfc_POLYGON>
CA	<S3: sfc_POLYGON>
CO	<S3: sfc_POLYGON>
leaflet(
  options= getLeafletOptions(5, 5)) %>%
  addPolygons(
    data=kdf_cast,
    weight=1,color='#000000', fillOpacity = 0.5, opacity=0.2,
    fillColor= ~getFactorPal(code)(code)) %>%
  addPolygons(
    data=kdf_cast.counties, group = 'NAME_1',
    weight=2,color='#000000',
    fill = T, opacity = 1, fillOpacity = 0,
    highlightOptions = highlightOptions(weight = 4)) %>%
  setMapWidgetStyle()
suppressPackageStartupMessages(library(tilegramsR))
library(leaflet)
# devtools::install_github('bhaskarvk/leaflet.extras')
library(leaflet.extras)
getLeafletOptions <- function(minZoom, maxZoom, ...) {
  leafletOptions(
    crs = leafletCRS("L.CRS.Simple"),
    minZoom = minZoom, maxZoom = maxZoom,
    dragging = FALSE, zoomControl = FALSE,
    tap = FALSE,
    attributionControl = FALSE , ...)
}
getFactorPal <- function(f) {
  colorFactor(colormap::colormap(
    colormap = colormap::colormaps$hsv,
    nshades = length(f)), f)
}
leaflet(
  options= getLeafletOptions(-1.5, -1.5)) %>%
  addPolygons(
    data=sf_FiveThirtyEightElectoralCollege,
    weight=1,color='#000000', fillOpacity = 0.5, opacity=0.2,
    fillColor= ~getFactorPal(state)(state)) %>%
  addPolygons(
    data=sf_FiveThirtyEightElectoralCollege.states, group = 'states',
    weight=2,color='#000000',
    fill = T, opacity = 1, fillOpacity = 0,
    highlightOptions = highlightOptions(weight = 4)) %>%
  addLabelOnlyMarkers(
    data=sf_FiveThirtyEightElectoralCollege.centers,
    label = ~as.character(state),
    labelOptions = labelOptions(
      noHide = 'T', textOnly = T,
      offset=c(-8,-20), textsize = '15px')) %>%
  setMapWidgetStyle()
