Creating a officer MS Word Chart object within a Rmd code block

I am trying to create Word document using inputs into a Shiny app.

The workflow would be:

  1. User enters data into a Shiny app
  2. The data is written to a Rmd
  3. The Rmd is knitted to Word

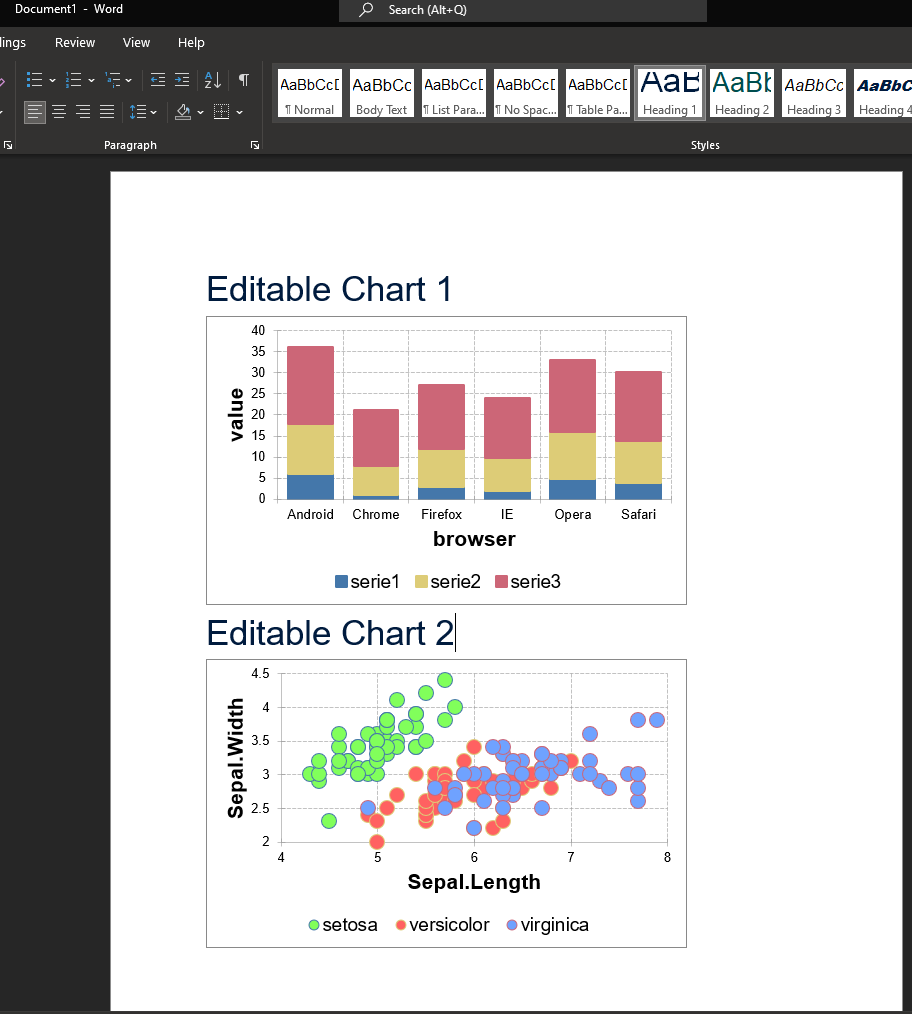
I am trying to take the input of the user to create a MS Word Chart object in the final word file. Is there a way to add code chunks in the Rmd which produce MS Word Charts. I know officeR has the capability to create Word docs with MS Word Charts, but the package requires to write the chart to an existing Word document. In my case, I want to write the MS Word Chart in the Word document which is being created from an Rmd.

Thanks

I believe MS Chart in officeverse is powered by the mschart package;

Maybe it can be used in Rmd without officer ?
Otherwise, officedown is a way to mix officer feature with R Markdown

Hope it helps

@cderv Thanks for your response. I have gone through the documentations you mention in detail before and could not find any officeR or mscharts function to return a MSChart while knitting an Rmd. I have come up with the following solution but am not sure how scalable this is.
The process I followed was to

  1. Set my YAML output as officedown::rdocx_document:
  2. Add r code chunks where I needed the the MSCharts to be output
  3. The code chunks would create the chart object (using mscharts::my_barchart ()),
  4. Write the chart object to a temp word document (using officer::body_add_chart())
  5. Inserting the chrt object back into the document (using officer::block_pour_docx())

Thoughts on this process? It seems a bit hacky; there might be a better/native way to do it using OfficeR/mscharts?

---
title: "MS Word with editable charts"
output:
  officedown::rdocx_document:
    reference_docx: WordTemplate.docx
    toc: yes
---

# Editable Chart1

```{r editable chart, echo=FALSE, include=TRUE}
library(mschart)
library(officer)
filename = paste0("Charts/Chart_1",format(Sys.time(), "%y%m%d%H%M%S"),".docx")

my_barchart <- ms_barchart(data = browser_data,
  x = "browser", y = "value", group = "serie")
my_barchart <- chart_settings( my_barchart, grouping = "stacked",
  gap_width = 50, overlap = 100 )

doc <- read_docx() %>%
  body_add_chart(chart = my_barchart, style = "centered") %>%
  print(target = filename)

block_pour_docx(filename)
``

# Editable Chart2

```{r editable chart2, echo=FALSE, include=TRUE}
library(mschart)
library(officer)
filename = paste0("Charts/Chart_2",format(Sys.time(), "%y%m%d%H%M%S"),".docx")

my_scatter <- ms_scatterchart(data = iris, x = "Sepal.Length",
  y = "Sepal.Width",  group = "Species")
my_scatter <- chart_data_fill(my_scatter,
  values = c(virginica = "#6FA2FF", versicolor = "#FF6161", setosa = "#81FF5B") )

doc <- read_docx() %>%
  body_add_chart(chart = my_scatter, style = "centered") %>%
  print(target = filename)

block_pour_docx(filename)
``

Which gives :point_down:

1 Like

As of 2020 it seems it was not possible from this SO question:

Probably still not possible... :thinking:

This seems like a good solution to me! In the R Markdown ecosystem there are a lot of post process of output (TeX, HTML, ...) so post processing your docx result using officer seems ok to me!

Thanks for the response, I'll mark my solution as 'Solution'.

1 Like

This topic was automatically closed 7 days after the last reply. New replies are no longer allowed.

If you have a query related to it or one of the replies, start a new topic and refer back with a link.