Creating clustered bar chart with ggplot

I would like to make a clustered/grouped bar chart with ggplot in R. However, I do not know how to make such a bar chart in the way I prefer. On the x-axis, I want to place 'drugset' and on the y-axis 'percentage'.

Here is an example of the data from which I want to make a clustered bar chart:

    Drugset     Percentage users
    Subset 1    58.63%
    Subset 2    76.25%
    Subset 3    27.27%
    Subset 4    30.43%

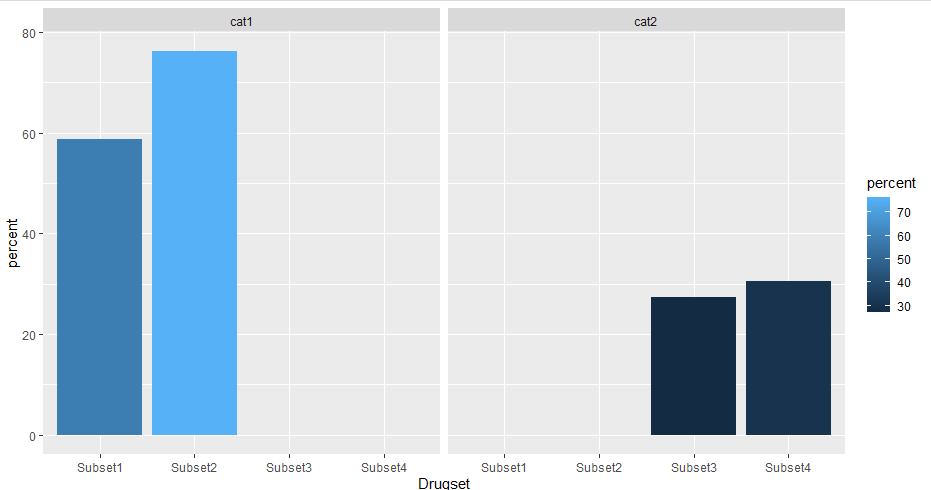
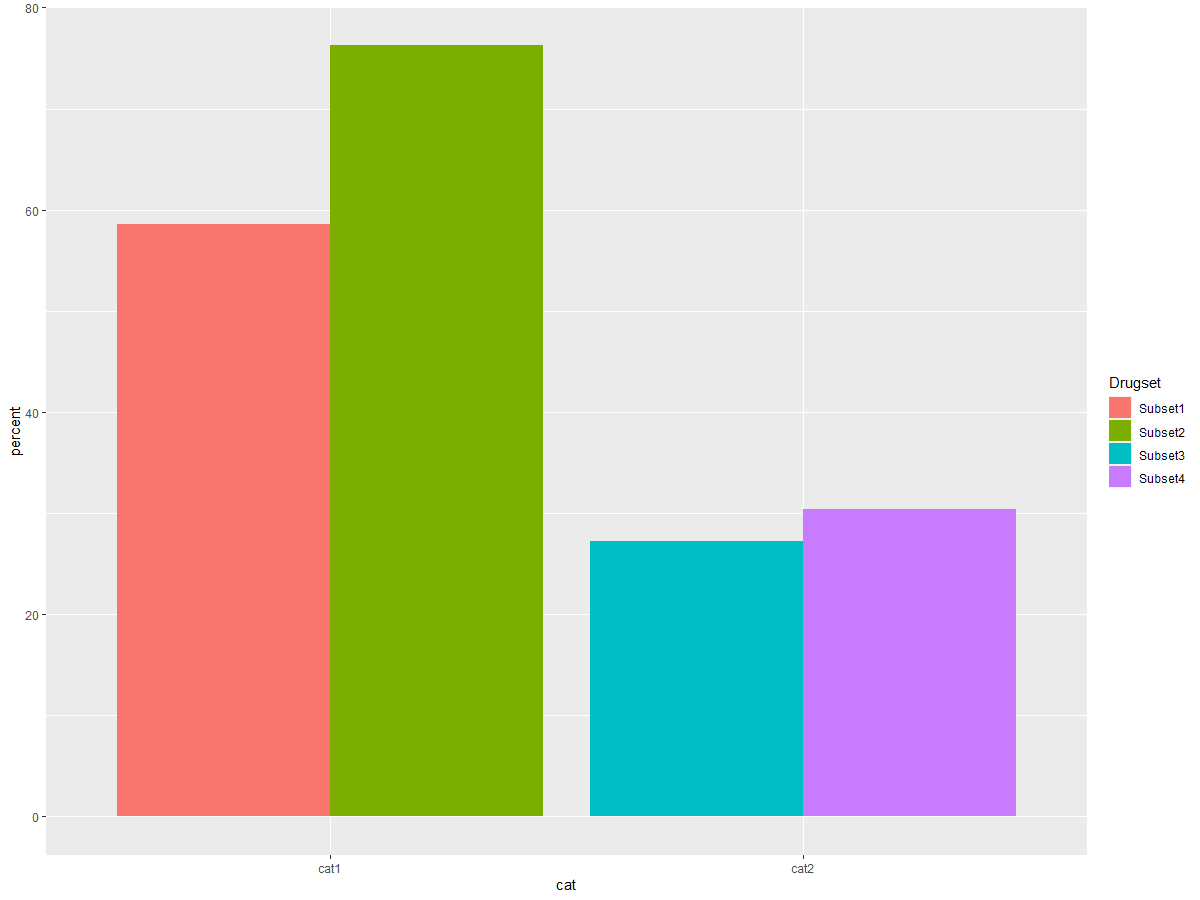
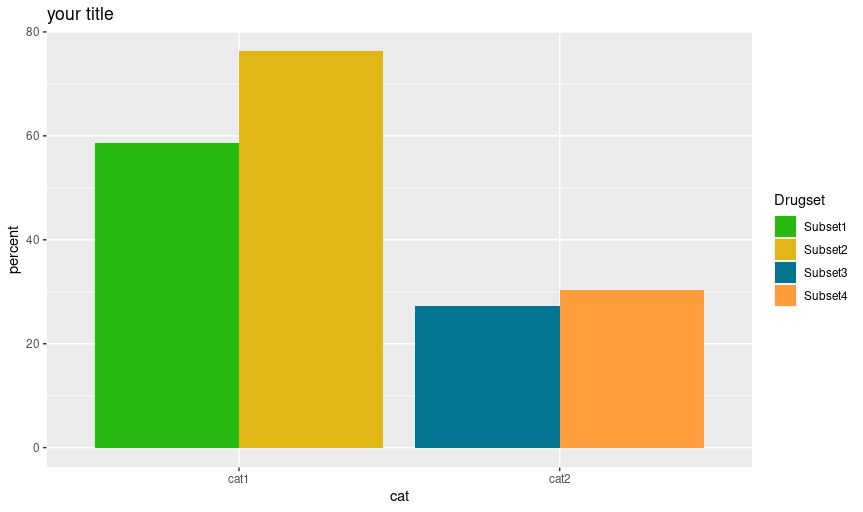
I would like to make one clustered bar chart where subset 1 and 2 are clustered (standing next to each other) and subset 3 and 4 as well. I am also wondering how to the change the colours.

Thanks for the help!

1 Like

below we can define our data frame :
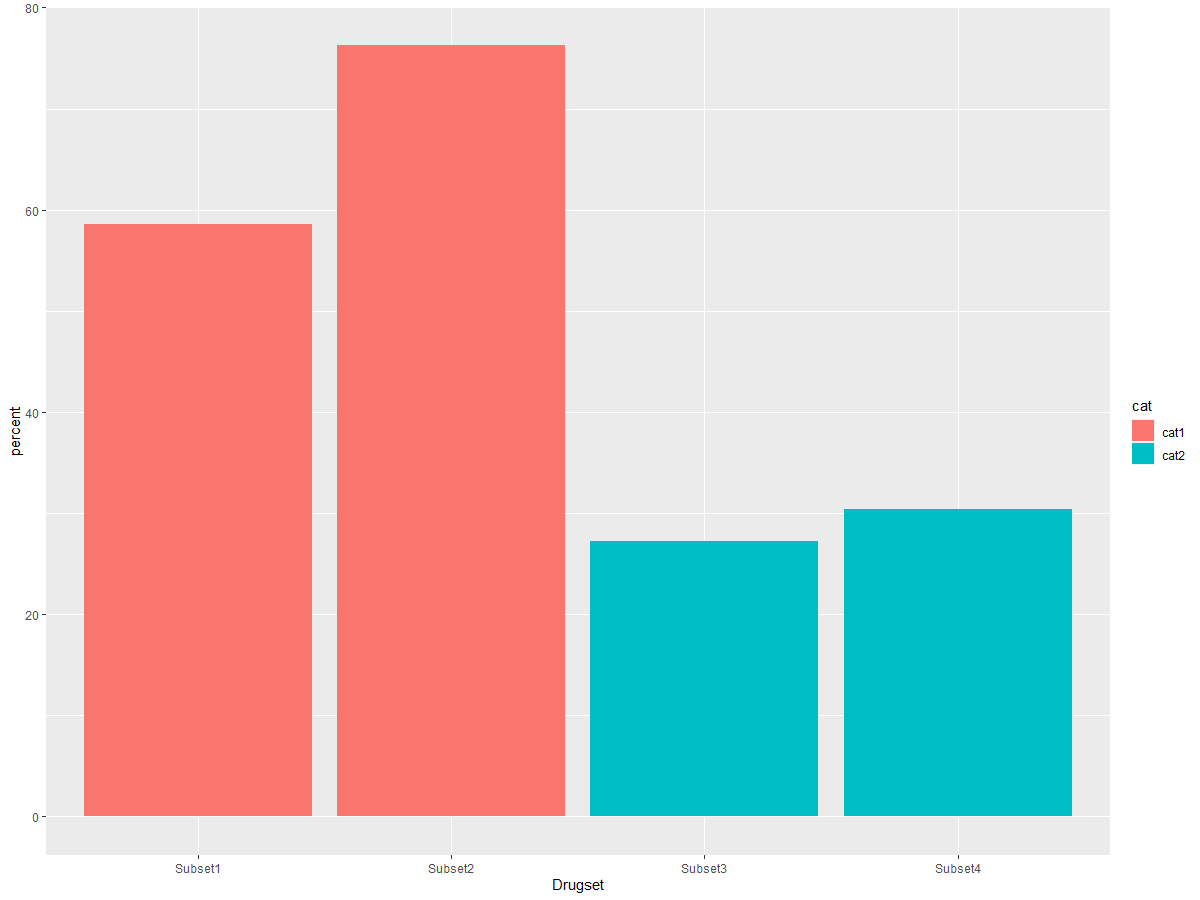
df <- data.frame(Drugset=c("Subset1","Subset2","Subset3","Subset4"),percent=c(58.63,76.25,27.27,30.43),cat=c("cat1","cat1","cat2","cat2"))

df %>% ggplot(aes(Drugset,percent,fill=percent))+geom_bar(stat = "identity")+facet_grid(~cat)

see below image :

hope this helpful

or you can have it in this way if you want :

df %>% ggplot(aes(Drugset,percent,fill=cat))+geom_bar(stat = "identity")

by giving two different colour

1 Like

This is very helpful, thankyou!
Is there also a way to get the two bars of subset 1 and 2 (with the pink/orange colour) more grouped together without the space in between?

is this what you are looking for :

df %>% ggplot(aes(cat,percent,fill=Drugset))+geom_bar(stat = "identity",position = position_dodge())

Kind Regards

Yes, this is exactly where I am looking for! :slight_smile:
Lots of thanks!

Do you also know how to change the colours of the bars?

use the scale_fill_* functions from ggplot2 to modify the color of filled bar charts

Hi @tronmed,

Im take the code maked for the other user and try to help you with the colors. You could use scale_fill_manual(). Like as they told you.

For select the best color you could use RGB tags. Select in this link.

For example, Im select four color, because the fill is about cat variable: 29BA12 , E1B715, 037590, and FF9D3C

Next you could add with the # in the script.

df %>% ggplot(aes(cat,percent,fill=Drugset))+
  geom_bar(stat = "identity",position = position_dodge())+
  scale_fill_manual(values=c("#29BA12","#E1B715","#037590","#FF9D3C")) +
  labs(title = 'your title') # for title

Clear, thankyou! Is there a way to re-order the legenda? For example that you get: subset 3, subset 4, subset 1, subset 2?

This topic was automatically closed 21 days after the last reply. New replies are no longer allowed.

If you have a query related to it or one of the replies, start a new topic and refer back with a link.