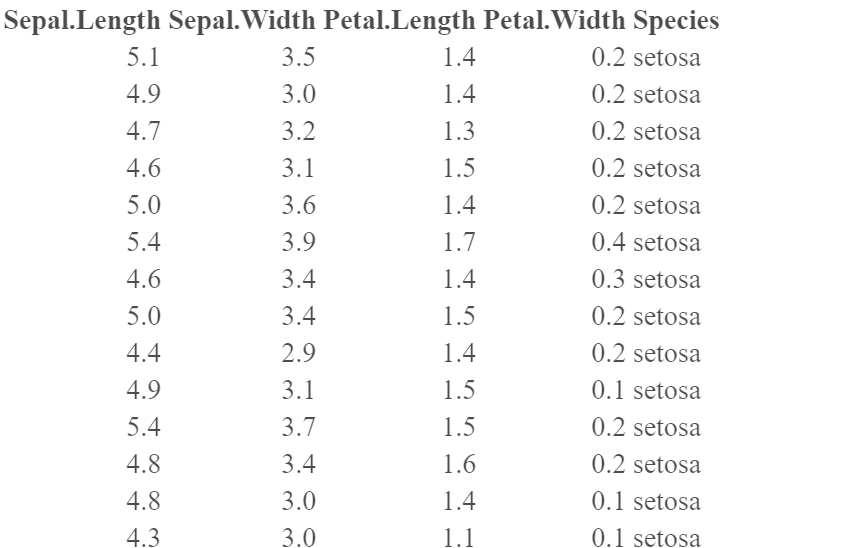
However, I wish to have the different spcies as columns and then a row of mean(sepal.Length), one of mean(Sepal.Width), one of mean(Petal.lenth) and a last of mean(Petal.Width). Also, I would like an extra column containing the sum of all species and which for all rows have the mean of the whole data set and not just for the specific species.
So far I have not found out how to solve this problem.
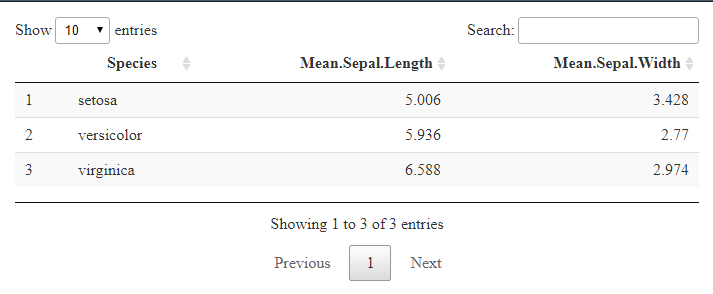
will give you the mean Sepal.length for each species. Just add on the other means in the same way.
There are many different ways of adding the column with the total, and this may not be the best way, but you could calculate it separately using exactly the same steps as for the individual species, but just not using group_by(Species), and then join it to the other means at the end using e.g full_join().
Finally, since you want the species as columns, you can transpose the table using t().
Thank you very much. I did not know the t() function. That is great.
I would like to make it where creating a data frame such that I can add a column with the p values of the different group means. This data frame I would eventually like to present in a pretty table with knitr or else?
I have run this with the transpose function, t(). Then I get the species in the columns, however, then I also get some V1, V2 and V3. Do you know how I can get rid of them?
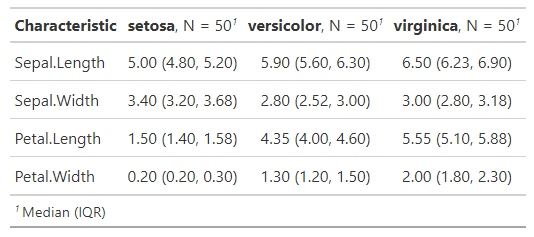
A slightly different way to accomplish your goal... you might interested in the gtsummary package which allows you make such summary tables very easily...