Customising ggplot2 boxplot output

Hi,

My colleagues have come up with a preferred style for boxplots that they create using matlab. I'd like to replicate the style in ggplot2.

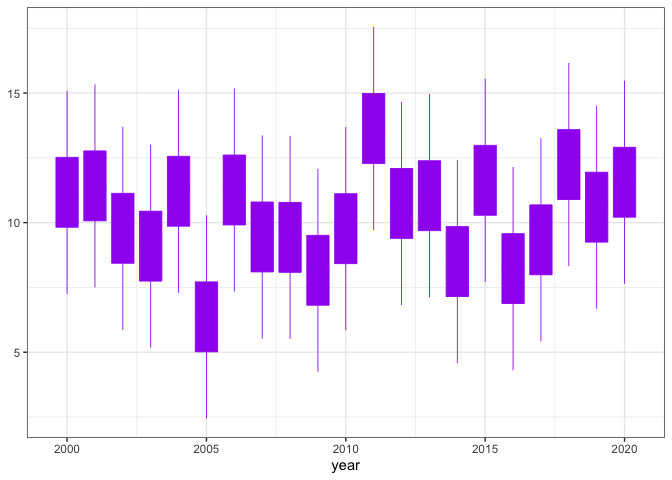
The features of interest are:

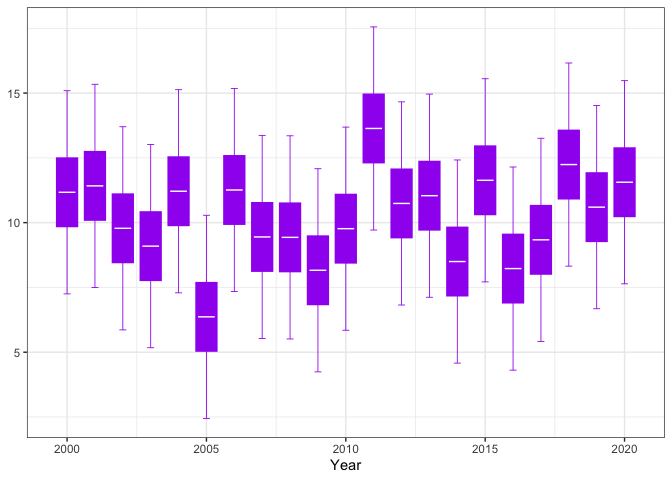
  • the colour and fill aesthetics would be the same, but the middle line would be white.
  • An errorbar style ('serifs', 'crossbars' at the end of the whiskers)

We always use stat = 'identity', as we choose to present 2.5, 25, 50, 75 and 97.5 percentiles.

I can't work out how to use stat_boxplot to add an errorbar in this case. If it is possible can I also control the width/length of the crossbars?

Is there a clean way to colour the middle line white? I think it would require overdrawing, and by accident I think I can do this with stat_boxplot(geom = 'errorbar', aes(y = median, group = year), but it doesn't seem like a very clean way to do it (I assume I've actually drawn two lines at the same y value? and a zero length line between them?).

Thanks for your time and help. A not-very-developed reprex follows.

Cheers,
Ron.

library(tidyverse)
set.seed(12345)
mm <- rnorm(21, 10, 2)
tbl <- map_dfr(mm, ~qnorm(c(0.025, 0.250, 0.500, 0.750, 0.975), .x, 2) %>%
                    set_names(.,c('q025', 'q250', 'q500', 'q750', 'q975'))) %>%
       mutate(year = 2000:2020)
ggplot(tbl) +
    geom_boxplot(aes(x = year, ymin = q025, lower = q250,
                     middle = q500, upper = q750, ymax = q975, group = year),
                 width = 0.8, size = 0.3, stat = 'identity', colour = 'purple', fill = 'purple') +
    #stat_boxplot(geom = 'errorbar',aes(x=year)) +
    theme_bw()

Created on 2023-05-02 by the reprex package (v2.0.1)

OK. I've had another go. See the reprex below.

So this, featuring geom_boxplot overdrawn with geom_errorbar and geom_linerange, gives me what I'd like.

So I've sort of answered my own question. I guess I could do it cleaner with geom_polygon rather than geom_boxplot with 0 width lines. But maybe not, as geom_boxplot automatically handles widths and positioning if there are multiple boxplots for each year (eg two variables).

How would I roll this into a custom geom?

library(tidyverse)
set.seed(12345)
mm <- rnorm(21, 10, 2)
tbl <- map_dfr(mm, ~qnorm(c(0.025, 0.250, 0.500, 0.750, 0.975), .x, 2) %>%
                    set_names(.,c('q025', 'q250', 'q500', 'q750', 'q975'))) %>%
       mutate(year = 2000:2020)
ggplot(tbl) +
    geom_boxplot(aes(x = year, ymin = q025, lower = q250,
                     middle = q500, upper = q750, ymax = q975, group = year),
                 width = 0.8, size = 0, stat = 'identity', colour = 'purple', fill = 'purple') +
    geom_errorbar(aes(x = year, ymin = q025, ymax = q975, group = year),
                  colour = 'purple', size = 0.3, width = 0.25) +
    geom_linerange(aes(xmin = year-0.3, xmax = year+0.3, y = q500), colour = 'white', size = 0.5) +
    theme_bw() +
    labs(x='Year',y=NULL)

Created on 2023-05-02 by the reprex package (v2.0.1)

Hi again,

OK, so I've had yet another go at this and the following reprex illustrates what I want to achieve pretty well:

library(tidyverse)
#
# Set up a simple example
set.seed(12345)
mm <- rnorm(21, 10, 2)
tbl1 <- map_dfr(mm, ~qnorm(c(0.025, 0.250, 0.500, 0.750, 0.975), .x, 2) %>%
                    set_names(.,c('q025', 'q250', 'q500', 'q750', 'q975'))) %>%
       mutate(year = 2000:2020, Analysis = 'a')
nn <- rnorm(21, 9, 2.5)
tbl2 <- map_dfr(nn, ~qnorm(c(0.025, 0.250, 0.500, 0.750, 0.975), .x, 2) %>%
                    set_names(.,c('q025', 'q250', 'q500', 'q750', 'q975'))) %>%
       mutate(year = 2000:2020, Analysis= 'b')
tbl <- bind_rows(tbl1,tbl2) %>% 
    mutate(yra = paste0(year, Analysis),
           yra = factor(yra, levels = paste0(rep(2000:2020, each = 2), rep(c('a','b'), times = 21))))
#
# Code which creates desired outcome --
#  **this is what I'd like to include in a custom geom**
#  equivalent to geom_boxplot with stat='identity', with:
#      - fill and colour the same 
#        EXCEPT for midline which is white (and a little narrower than box)
#      - errorbars for whiskers
#
plot_trends <- function(data,
                        x             = "year",
                        ymin          = "q025",
                        lower         = "q250",
                        middle        = "q500",
                        upper         = "q750",
                        ymax          = "q975",
                        anal          = "anal",
                        # total width of boxes within year (0-1)
                        width         = 0.7,    
                        # crossbar width (mid-point) as proportion of box width
                        crossbar_prop = 0.8,
                        # errorbar width (serifs on whiskers) as proportion of box width
                        errorbar_prop = 0.5,
                        anal_levels = NA,
                        anal_labels = NA){

    tbl <- tibble(year = unlist(data[,x]),
                  q025 = unlist(data[,ymin]),
                  q250 = unlist(data[,lower]),
                  q500 = unlist(data[,middle]),
                  q750 = unlist(data[,upper]),
                  q975 = unlist(data[,ymax]),
                  anal = unlist(data[,anal]))

    if (sum(is.na(anal_levels)) == length(anal_levels)) {
        anal_levels <- unique(data$anal)
    }
    if (sum(is.na(anal_labels)) == length(anal_labels)) {
        anal_labels <- anal_levels
    }

    measurements <- tbl %>%
        group_by(year) %>%
        summarise(n_boxes = n()) %>%
        ungroup %>%
        mutate(group_width = width,
               box_width = group_width/n_boxes,
               bar_width = box_width*crossbar_prop,
               err_width = box_width*errorbar_prop)

    tbl <- left_join(tbl, measurements) %>%
        mutate(anal_fac = factor(anal, levels = anal_levels, labels = anal_labels)) %>%
        arrange(year, anal_fac) %>%
        group_by(year) %>%
        mutate(box_within_year = row_number()) %>%
        ungroup %>%
        mutate(minyr = year-(group_width/2),
               yrmin  = minyr+box_width*(box_within_year-1),
               yrmax  = yrmin+box_width,
               yrmid  = (yrmax+yrmin)/2)

    tbl %>% ggplot(.) +
        geom_errorbar(
            aes(x = yrmid,
                ymin = q025,
                ymax = q975,
                colour = anal_fac,
                width = err_width),
            stat = 'identity'
        ) +
        geom_rect(
            aes(xmin = yrmin,
                xmax = yrmax,
                ymin = q250,
                ymax = q750,
                fill = anal_fac),
            colour = NA
        ) +
        geom_linerange(
            aes(y = q500,
                xmin = yrmid-(bar_width/2),
                xmax = yrmid+(bar_width/2)),
            colour = 'white',
            size = 0.75
        )
}

tbl_plot <- plot_trends(tbl,anal="Analysis",anal_levels=c("b","a"),anal_labels=c("B","A"))
#> Joining, by = "year"

tbl_plot+labs(x=NULL,y='Cases')+theme_bw()+theme(legend.position='none')

Created on 2023-05-16 by the reprex package (v2.0.1)

I am pretty happy with what I have there, but I'd like the flexibility of having it in a custom geom so that I can benefit from facetting etc. So I've tried to create a geom, copying at the structure from what I can see in the geom_boxplot and GeomBoxplot code, and using the bulk of th code in the reprex above:

geom_kat <- function(mapping = NULL, data = NULL,
                     # total width of boxes within year (0-1)
                     width         = 0.7,    
                     # crossbar width (mid-point) as proportion of box width
                     crossbar_prop = 0.8,
                     # errorbar width (serifs on whiskers) as proportion of box width
                     errorbar_prop = 0.5,
                     ...){
  position <- position_identity()
  stat <- "identity"
  inherit.aes <- TRUE
  show.legend <- NA
  layer(
    data = data,
    mapping = mapping,
    stat = stat,
    geom = GeomKat,
    position = position,
    show.legend = show.legend,
    inherit.aes = inherit.aes,
    params = list(
      width = width,
      crossbar_prop = crossbar_prop,
      errorbar_prop = errorbar_prop,
      ...
    )
  )
}

GeomKat <- ggproto("GeomKat", Geom,
  setup_data = function(data, params){

    measurements <- data %>%
        group_by(x) %>%
        summarise(n_boxes = n()) %>%
        ungroup %>%
        mutate(width = params$width,
               box_width = width/n_boxes,
               bar_width = box_width*params$varwidth, #0.8, #params$crossbar_prop,
               err_width = box_width*params$relvarwidth) #0.5) #params$errorbar_prop)

    data <- left_join(data, measurements, by = "year") %>%
        mutate(anal_fac = factor(anal, levels = anal_levels, labels = anal_labels)) %>%
        arrange(x, anal_fac) %>%
        group_by(x) %>%
        mutate(box_within_x = row_number()) %>%
        ungroup %>%
        mutate(minx = year-(width/2),
               xmin  = minx+box_width*(box_within_x-1),
               xmax  = xmin+box_width,
               xmid  = (xmax+xmin)/2)

    data
  },

  draw_group = function(self, data, panel_params, coord){
    ggname("geom_kat", grobTree(
      GeomErrorbar$draw_panel(data, panel_params, coord),
      GeomRect$draw_panel(self, data, panel_params, coord),
      GeomLinerange$draw_panel(data, panel_params, coord)
    ))
  },

  draw_key = draw_key_rect,

  required_aes = c("x", "ymin", "lower", "middle", "upper", "ymax")
)


ggname <- function(prefix, grob) {
  grob$name <- grid::grobName(grob, prefix)
  grob
}

But I get errors (using the tbl from the first reprex):

pp <- ggplot(tbl)+geom_my_boxplot(mapping = aes(x = year, ymin = q025, lower = q250,
+                                 middle = q500, upper = q750, ymax = q975, fill = Analysis))
Warning messages:
1: Ignoring unknown parameters: width, crossbar_prop, errorbar_prop
2: Ignoring unknown aesthetics: fill

I've tried tweaking some things, but with no luck. Probably because I don't really understand what I'm doing and am flailing around in the dark a bit.

Anybody with experience of making a custom geom, or an interest in the area, that can help me out here?

Thanks in advance,

Ron.

Can you provide the code for GeomKat?

Hi @thomasp85,

It's in that code chunk above, it follows the geom_kat function.

Cheers,
Ron.

Ah, sorry — don’t know how I was able to miss that. In ggplot2 the parameters available to a geom is by default deduced by the arguments to its draw_group/draw_panel methods. But since these aren’t used there you have to put it in the extra_params field of the class.

For the aesthetics, those aesthetics a geom reacts to is deduced by the required_aes, default_aes, optional_aes and non_missing_aes fields. You don’t provide any defaults for fill so the geom assumes you don’t use it

1 Like

Thanks very much for the input.

I will go and give that a try now.

Hi @thomasp85 ,

I've had another go, and I think I've made some progress, but now I'm stuck again.

My current geom code looks like this:

geom_kat <- function(mapping = NULL, data = NULL,
                     # total width of boxes within year (0-1)
                     width         = 0.7,    
                     # crossbar width (mid-point) as proportion of box width
                     crossbar_prop = 0.8,
                     # errorbar width (serifs on whiskers) as proportion of box width
                     errorbar_prop = 0.5,
                     linewidth = 0.5,
                     na.rm = FALSE,
                     ...){
  position <- position_identity()
  stat <- "identity"
  inherit.aes <- TRUE
  show.legend <- NA
  layer(
    data = data,
    mapping = mapping,
    stat = stat,
    geom = GeomKat,
    position = position,
    show.legend = show.legend,
    inherit.aes = inherit.aes,
    params = list(
      na.rm = na.rm,
      width = width,
      crossbar_prop = crossbar_prop,
      errorbar_prop = errorbar_prop,
      linewidth = linewidth,
      ...
    )
  )
}

GeomKat <- ggproto("GeomKat", Geom,
  extra_params = c("na.rm", "width", "crossbar_prop", "errorbar_prop", "linewidth"),

  setup_data = function(data, params){
    print(params)

    measurements <- data %>%
        group_by(x) %>%
        summarise(n_boxes = n()) %>%
        ungroup %>%
        mutate(width = params$width,
               linewidth = params$linewidth,
               box_width = width/n_boxes,
               bar_width = box_width*params$crossbar_prop,
               err_width = box_width*params$errorbar_prop)
    print(measurements)

    data <- left_join(data, measurements, by = "x") %>%
        #mutate(anal_fac = factor(anal, levels = anal_levels, labels = anal_labels)) %>%
        arrange(x, fill) %>%  #anal_fac) %>%
        group_by(x) %>%
        mutate(box_within_x = row_number()) %>%
        ungroup %>%
        mutate(minx = x-(width/2),
               xmin  = minx+box_width*(box_within_x-1),
               xmax  = xmin+box_width,
               xmid  = (xmax+xmin)/2,
               crossbar_min = xmid-(err_width/2),
               crossbar_max = xmid+(err_width/2),
               group = seq_len(nrow(data)))
    print(data)

    data
  },

  draw_group = function(self, data, panel_params, coord){
    whiskers <- data %>%
        select(x = xmid, ymin, ymax,
               colour = fill, PANEL, group, width = err_width, linewidth) 

    boxes <- data %>%
        select(xmin, xmax, ymin = lower, ymax = upper,
               fill, colour = fill, PANEL, group)

    bars <- data %>%
        select(y = middle, xmin = crossbar_min, xmax = crossbar_max,
               colour = fill, PANEL, group, linewidth) 
    print(whiskers)
    print(boxes)
    print(bars)

    ggname("geom_kat", grid::grobTree(
      GeomErrorbar$draw_panel(whiskers, panel_params, coord),
      GeomRect$draw_panel(boxes, panel_params, coord),
      GeomLinerange$draw_panel(bars, panel_params, coord)
    ))
  },

  draw_key = draw_key_rect,

  required_aes = c("x", "ymin", "lower", "middle", "upper", "ymax"),
  default_aes = aes(fill = "grey35", colour = NA)
)


ggname <- function(prefix, grob) {
  grob$name <- grid::grobName(grob, prefix)
  grob
}

and I get the following when I run it (again with the data from the original example):

> source('geom_kat2.R')
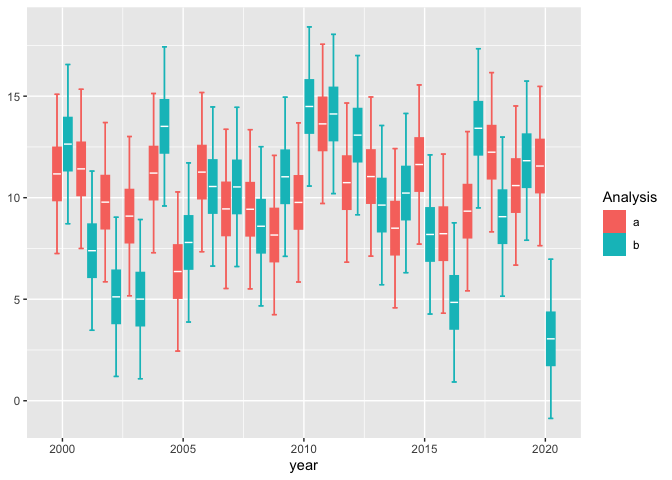
> ggplot(tbl)+geom_kat(aes(x=year,ymin=q025,lower=q250,middle=q500,upper=q750,ymax=q975,fill=Analysis))
Error in `geom_kat()`:
! Problem while converting geom to grob.
ℹ Error occurred in the 1st layer.
Caused by error in `data_frame()`:
! Can't recycle `x` (size 4) to size 8.

Any suggestions?

And a secondary question: how can I specify default columns in default_aes? I've tried x = year, x = "year" and x = ~year so far.

Thanks again for the help,

Ron.

Hi again,

Change of strategy over the weekend, switched from trying to go from ggplot code to a geom to hacking the geom_boxplot code from github (deleting outlier bits, switching to errorbar instead of segment whiskers, etc). I seem to have something that works now and will post that as an answer once I've polished it a wee bit.

In the meantime, I'm still interested to know how I can specify a column name as the default (eg to have a default x, ymin, etc column default to year, q025, etc).

So, @thomasp85 thanks for your help with the previous code, that has helped me tremendously, and don't spend any time thinking about the last error report. I had something missing from the data being passed to GeomErrorbar - I hit the same problem over the weekend with my new code and solved it.

Back in a bit with a solution, just in case anyone finds it helpful in the future.

Ron.

So here's a reprex of my solution, with @thomasp85's help.

The only thing missing, I think, is the ability to specify default columns (I'm lazy and my columns are generally named the same thing each time).

I'll have to pop it in a little package to share with my colleagues, probably with a scale_fill_kat to use our preferred palette and a theme subroutine to standardise a few bits and bobs.

Ron.

library(tidyverse)


geom_kat <- function(mapping = NULL, data = NULL,
                         position = "dodge2",
                         width = 0.75,
                         # width of whisker errorbar as proportion of box width
                         errorbar_prop = 0.5,
                         # width of midline as proportion of box width
                         midline_prop = 0.8,
                         ...,
                         show.legend = NA,
                         inherit.aes = TRUE) {

  # varwidth = TRUE is not compatible with preserve = "total"
  if (!is.character(position)) {
    if (identical(position$preserve, "total") & varwidth == TRUE) {
      cli::cli_warn("Can't preserve total widths when {.code varwidth = TRUE}.")
      position$preserve <- "single"
    }
  }

  layer(
    data = data,
    mapping = mapping,
    stat = "identity",
    geom = GeomKat,
    position = position,
    show.legend = show.legend,
    inherit.aes = inherit.aes,
    params = list(
      notch = FALSE,
      notchwidth = 0.5,
      varwidth = FALSE,
      na.rm = FALSE,
      errorbar_prop = errorbar_prop,
      midline_prop = midline_prop,
      ...
    )
  )
}

GeomKat <- ggproto("GeomKat", Geom,

  # need to declare `width` here in case this geom is used with a stat that
  # doesn't have a `width` parameter (e.g., `stat_identity`).
  extra_params = c("na.rm", "width", "errorbar_prop", "midline_prop"),

  setup_params = function(data, params) {
     params$flipped_aes <- FALSE
     params
   },

  setup_data = function(data, params) {
    data$flipped_aes <- params$flipped_aes
    data <- flip_data(data, params$flipped_aes)

    # force each row to be a group so you don't need to create
    # a x*fill interaction grouping
    data$group <- 1:nrow(data)

    data$width <- data$width %||%
      params$width %||% (resolution(data$x, FALSE) * 0.9)
    data$xmin <- data$x - data$width / 2
    data$xmax <- data$x + data$width / 2
    data$width <- NULL

    # Used to generate x coordinates for errorbar and midline in draw_group
    data$errorbar_prop <- params$errorbar_prop
    data$midline_prop <- params$midline_prop

    if (!is.null(data$relvarwidth)) data$relvarwidth <- NULL

    flip_data(data, params$flipped_aes)
  },

  draw_group = function(self, data, panel_params, coord, lineend = "butt",
                        linejoin = "mitre", fatten = 2,
                        notch = FALSE, notchwidth = 0.5,
                        varwidth = FALSE, flipped_aes = FALSE) {
    #REC data <- check_linewidth(data, snake_class(self))
    data <- flip_data(data, flipped_aes)

    data$colour <- data$fill
    data$xwid <- data$xmax - data$xmin
    data$errorbar_xmin <- data$x - data$xwid * data$errorbar_prop / 2
    data$errorbar_xmax <- data$x + data$xwid * data$errorbar_prop / 2
    data$midline_xmin <- data$x - data$xwid * data$midline_prop / 2
    data$midline_xmax <- data$x + data$xwid * data$midline_prop / 2

    common <- list(
      linewidth = data$linewidth,
      linetype = data$linetype,
      fill = alpha(data$fill, data$alpha),
      group = data$group
    )

    whiskers <- vctrs::data_frame(
      x = data$x,
      ymin = data$ymin,
      ymax = data$ymax,
      xmin = data$errorbar_xmin,
      xmax = data$errorbar_xmax,
      colour = data$colour,
      alpha = NA_real_,
      !!!common,
      .size = 2
    )
    whiskers <- flip_data(whiskers, flipped_aes)

    box <- vctrs::data_frame(
      xmin = data$xmin,
      xmax = data$xmax,
      ymin = data$lower,
      y = data$middle,
      ymax = data$upper,
      ynotchlower = NA,
      ynotchupper = NA,
      notchwidth = notchwidth,
      alpha = data$alpha,
      colour = NA,
      !!!common
    )
    box <- flip_data(box, flipped_aes)

    line <- vctrs::data_frame(
      x = data$midline_xmin,
      xend = data$midline_xmax,
      y = data$middle,
      yend = data$middle,
      alpha = NA_real_,
      colour = "#ffffff",
      !!!common
    )
    line <- flip_data(line, flipped_aes)

    ggname("geom_kat", grid::grobTree(
      GeomErrorbar$draw_panel(whiskers, panel_params, coord, lineend = lineend),
      GeomCrossbar$draw_panel(
        box,
        fatten = fatten,
        panel_params,
        coord,
        lineend = lineend,
        linejoin = linejoin,
        flipped_aes = flipped_aes
      ),
      GeomSegment$draw_panel(line, panel_params, coord, lineend = lineend)
    ))
  },

  draw_key = draw_key_rect,

  default_aes = aes(weight = 1, colour = "grey35", fill = "grey35", size = NULL,
    alpha = NA, shape = 19, linetype = "solid", linewidth = 0.5),

  required_aes = c("x", "lower", "upper", "middle", "ymin", "ymax"),

  rename_size = TRUE
)

ggname <- function(prefix, grob) {
  grob$name <- grid::grobName(grob, prefix)
  grob
}


#
# Set up a simple example
set.seed(12345)
mm <- rnorm(21, 10, 2)
tbl1 <- map_dfr(mm, ~qnorm(c(0.025, 0.250, 0.500, 0.750, 0.975), .x, 2) %>%
                    set_names(.,c('q025', 'q250', 'q500', 'q750', 'q975'))) %>%
       mutate(year = 2000:2020, Analysis = 'a')
nn <- rnorm(21, 9, 2.5)
tbl2 <- map_dfr(nn, ~qnorm(c(0.025, 0.250, 0.500, 0.750, 0.975), .x, 2) %>%
                    set_names(.,c('q025', 'q250', 'q500', 'q750', 'q975'))) %>%
       mutate(year = 2000:2020, Analysis= 'b')
tbl <- bind_rows(tbl1,tbl2) %>% 
    mutate(yra = paste0(year, Analysis),
           yra = factor(yra, levels = paste0(rep(2000:2020, each = 2), rep(c('a','b'), times = 21))))
rm(list = c("mm", "nn", "tbl1", "tbl2"))

kk <- ggplot(tbl)+geom_kat(aes(x = year, ymin = q025, lower = q250, middle = q500, upper = q750, ymax = q975, fill = Analysis))

print(kk)

Created on 2023-05-30 with reprex v2.0.2

1 Like

Fantastic progress. Regarding the default aesthetics, there is no way to have a default that refers to a column name in the data. The technical reason is that the defaults are only added way later when the original dataset has been lost. The non-technical reason is that it is a bad idea :smile: because you couple your code tightly with the format of the data, something that ggplot2 in general goes against...

If you are dead-set on having a default column you can modify geom_kat() to inspect the mapping argument and add an x mapping if none exists, but that would prevent you from setting the mapping in the ggplot() call, so it is not really something I'd recommend

1 Like

That makes sense. I guess I'm just about finished then.

Thanks for your time and comments. Much appreciated.

Ron.

1 Like

This topic was automatically closed 7 days after the last reply. New replies are no longer allowed.

If you have a query related to it or one of the replies, start a new topic and refer back with a link.