Data prediction for missing data

Hi all,

I am new to R. I am analyzing export Wh, data for my project.
Original csv file (org_data.csv) that I m analyzing can be found in this link:
[https://drive.google.com/open?id=12a3EfbSKKuPRAYUC-c58tbnBaiVlweVI ]

In the original csv file, there are 1,584,823 total records, with 157 meters.
Recorded from 1-Oct-2015 00:00:00 to 31-Mar-2016 23:59:59

In the csv file, there are three columns: local minutes, dataID, meter_value.

  • Local minutes is formatted with “yyyy-mm-dd hh:mm:ss-UTC
    time offset”.
  • dataID represents the ID number for each 157 meter,
  • meter_value represents the export Wh

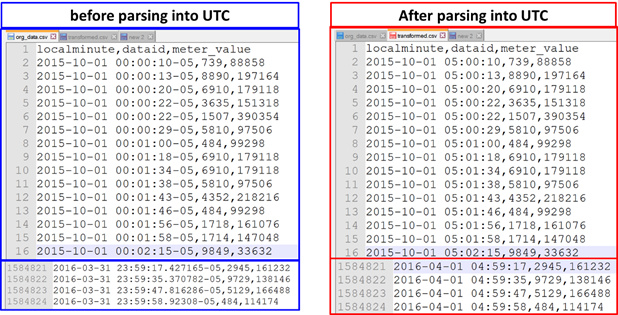
Quick view of original csv file, as below:

localminute,dataid,meter_value
2015-10-01 00:00:10-05,739,88858
2015-10-01 00:00:13-05,8890,197164
2015-10-01 00:00:20-05,6910,179118
2015-10-01 00:00:22-05,3635,151318
2015-10-01 00:00:22-05,1507,390354
2015-10-01 00:00:29-05,5810,97506
2015-10-01 00:01:18-05,6910,179118
2015-10-01 00:01:34-05,6910,179118
2015-10-01 00:01:38-05,5810,97506
2015-10-01 00:01:43-05,4352,218216
2015-10-01 00:01:46-05,484,99298
2015-10-01 00:01:56-05,1718,161076
2015-10-01 00:01:58-05,1714,147048

We can observe that, export Wh are recorded every minute for each dataID, but there are only 6 export Wh records for 2015-10-01 00:00:xx. There are missing records for remaining 151 meters.

Same goes for 2015-10-01 00:01:xx, there are only 7 meters recorded in the csv file. 150 meters' records are missing.

Objective of this project is to write algorithm to fill these missing data for 56 meters. Hence, there should have 56 records for each minutes starting from 1-Oct-2015 00:00:00 to 31-Mar-2016 23:59:59.

the dataID that I would like to predict missing data, are as below:
9729,9639,9295,9134,8890,8829,8156,7989,7674,7429,
7287,7117,7030,7017,6910,6673,6412,5892,5814,5810,
5785,5403,5193,5131,4998,4514,4031,4029,3893,3778,
3527,3367,3310,2461,2129,2094,2072,2034,1801,1791,
1790,1718,1714,1589,1507,1283,1185,1086,871,739,
484,483,252,94,77,35

Before data prediction, I have done:

  1. data importing (read csv file in R-studio)
  2. data processing: convert “localminute” to “datetime” type and “dataid” converts to “factor” type.
  3. data visualization: plot all the dataID using facet function

This is the 56 meters of existing data plot. Existing data, most of all meters are linearly increasing. Based on these existing data, I have to write algorithm for missing data prediction algorithm.

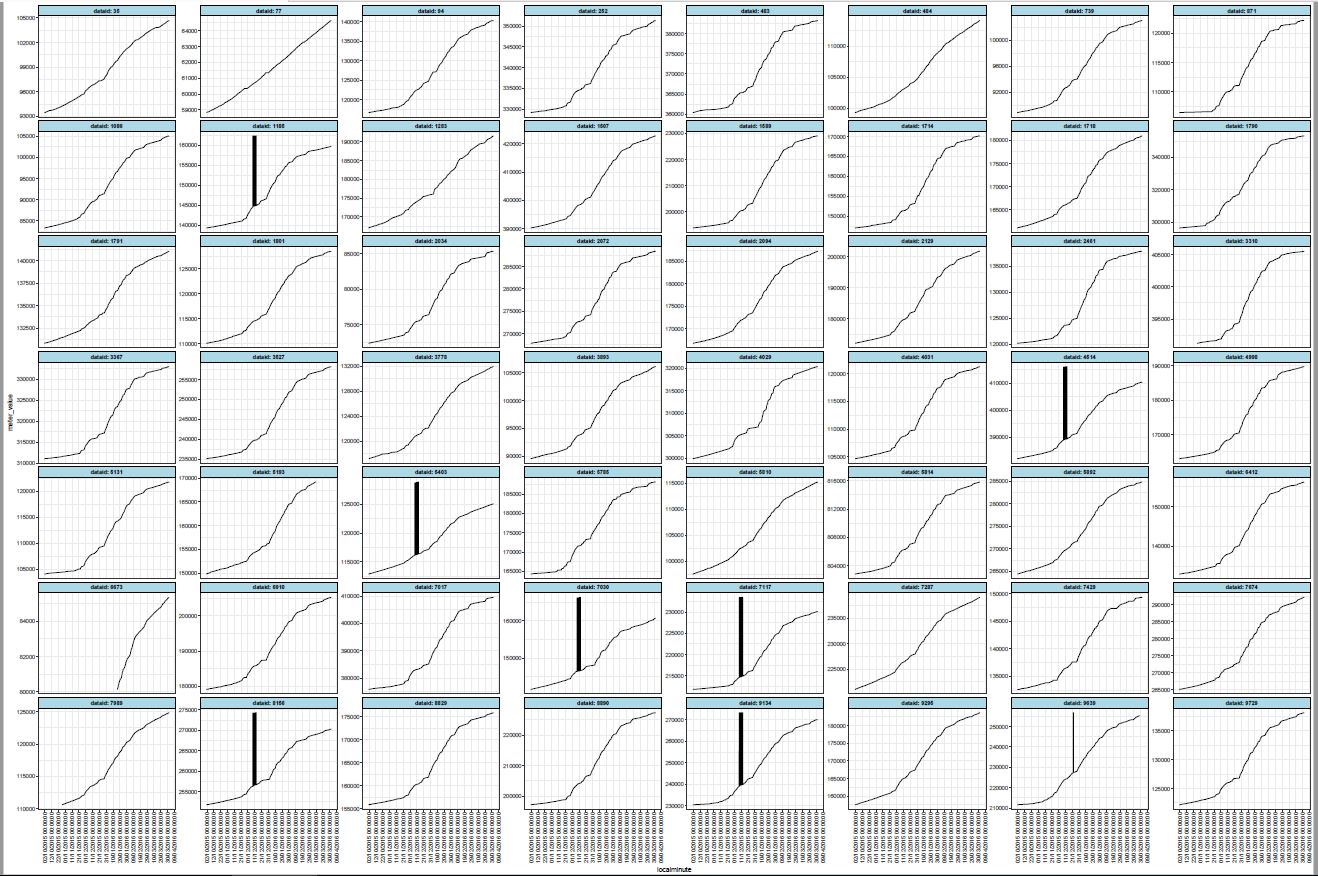
Out of these 56 meters, there are some spikes in certain meter IDs, for december. These spikes (I assume noisy data), will be another issue. Hence,I also would like to ask, how should I predict for missing data of those meterID that has spikes in existing data.

1 Like

There are loads of methods for imputing missing values. This article may be helpful to you.

2 Likes

I feel this might be too big of a question without additional info.

For example, is this a standard problem with which you might point to standard methods you're looking to implement? Could you point to those? (There's a good amount of research on this. )

You should offer a minimal REPRoducible EXample (reprex)? (A reprex makes it much easier for others to understand your issue and figure out how to help.) Perhaps with just a couple of meters, timestamps, and examples of missing data.

You might give more background, for example, I see a ton of obs on meter id 35 (assuming dataid is your standin for meter id), it's not clear what's missing. Are these supposed to be synchronous observations?


Having said all that, assuming your looking for synchronous observations (an obs for every meter at every minute), you might just use the last obs available.

1 Like

I'm a big fan of this article on Missing Data Imputation (by Andrew Gelman, I believe) which includes R code for various methods, as well:
http://www.stat.columbia.edu/~gelman/arm/missing.pdf

Packages worth checking out (mentioned in this RViews post by Joseph Rickert, Missing Values, Data Science and R)

Amelia implements the Amelia II algorithm which assumes that the complete data set (missing and observed data) are multivariate normal. Imputations are done via the EMB (expectation-maximization with bootstrapping) algorithm. The JSS paper describes a strategy for combining the models resulting from each imputed data set. The Amelia vignette contains examples.

BaBoon provides two variants of the the Bayesian Bootstrap predictive mean matching to impute multiple missing values. Originally developed for survey data, the imputation algorithms are described as being robust with respect to imputation model misspecification. The best description and rationale for the algorithms seems to be the PhD thesis of one of the package authors.

Hmisc contains several functions that are helpful for missing value imputation including agreImpute() , impute() and transcan() . Documentation on Hmisc can be found here.

mi takes a Bayesian approach to imputing missing values. The imputation algorithm runs multiple MCMC chains to iteratively draw imputed values from conditional distributions of observed and imputed data. In addition to imputation algorithm, the package contains functions for visualizing the pattern of missing values in a data set and assessing the convergence of the MCMC chains. A vignetteshows a worked example and the associated JSS paper delves deeper into the theory and the mechanics of using the method.

mice which is an acronym for multivariate imputation of chained equations, formalizes the multiple implementation process outline above and is probably the gold standard for FCS multiple imputation. Package features include:

  • Columnwise specification of the imputation model
  • Support for arbitrary patterns of missing data
  • Passive imputation techniques that maintain consistency among data transformations
  • Subset selection of predictors
  • Support of arbitrary complete-data methods
  • Support pooling various types of statistics
  • Diagnostics for imputations
  • Callable user-written imputation functions
1 Like

Hi Curtis,

I edited my fist post, added my project background, what I have done, and my objective which is predicting the missing data for certain DataID.

Here my codes for data importing, processing.

I didn't add data visualization codes, hence it is not related for what I wanted to learn about predicting missing data.


  #-----------loading packages----------------------------
library(tidyverse) # load packages for data visualization, import,manipulation, tidying
library(lubridate) # easier to work with dates and times in R
library(data.table) # extension of data frame. “Data.table” package adds its own class to data frames it creates. It also adds certain attributes related to memory management.

#---------Data importing to R(Read csv file to R) --------------------
sensor_data <- data.table::fread("org_data.csv") 

 #---------Data Processing: Converting variables --------------------*
sensor_data <- sensor_data %>% mutate(localminute =lubridate::as_datetime(localminute),dataid=factor(dataid)) 
# convert dataid (integer type) to factor type
# convert localminute to datetime (fread imports it as character)

After converting variables, I could see that, UTC values are offset as shown in picture below:
image

From parsed localminute, there are missing data for all 56 meters, from 1-Oct-2015 00:00:00 to 04:59:59.

May I know how should I fill up these missing data?

Lots of good resources shared above.

I wonder if a "good enough" solution for your question would be to code all your noisy readings as NA's and then use the na.approx function from the zoo package to get a linear interpolation.
https://www.rdocumentation.org/packages/zoo/versions/1.8-3/topics/na.approx

1 Like